Siemens 2010 Annual Report Download - page 298
Download and view the complete annual report
Please find page 298 of the 2010 Siemens annual report below. You can navigate through the pages in the report by either clicking on the pages listed below, or by using the keyword search tool below to find specific information within the annual report.-
 1
1 -
2
-
3
-
4
-
5
-
6
-
7
-
8
-
9
-
10
-
11
-
12
-
13
-
14
-
15
-
16
-
17
-
18
-
19
-
20
-
21
-
22
-
23
-
24
-
25
-
26
-
27
-
28
-
29
-
30
-
31
-
32
-
33
-
34
-
35
-
36
-
37
-
38
-
39
-
40
-
41
-
42
-
43
-
44
-
45
-
46
-
47
-
48
-
49
-
50
-
51
-
52
-
53
-
54
-
55
-
56
-
57
-
58
-
59
-
60
-
61
-
62
-
63
-
64
-
65
-
66
-
67
-
68
-
69
-
70
-
71
-
72
-
73
-
74
-
75
-
76
-
77
-
78
-
79
-
80
-
81
-
82
-
83
-
84
-
85
-
86
-
87
-
88
-
89
-
90
-
91
-
92
-
93
-
94
-
95
-
96
-
97
-
98
-
99
-
100
-
101
-
102
-
103
-
104
-
105
-
106
-
107
-
108
-
109
-
110
-
111
-
112
-
113
-
114
-
115
-
116
-
117
-
118
-
119
-
120
-
121
-
122
-
123
-
124
-
125
-
126
-
127
-
128
-
129
-
130
-
131
-
132
-
133
-
134
-
135
-
136
-
137
-
138
-
139
-
140
-
141
-
142
-
143
-
144
-
145
-
146
-
147
-
148
-
149
-
150
-
151
-
152
-
153
-
154
-
155
-
156
-
157
-
158
-
159
-
160
-
161
-
162
-
163
-
164
-
165
-
166
-
167
-
168
-
169
-
170
-
171
-
172
-
173
-
174
-
175
-
176
-
177
-
178
-
179
-
180
-
181
-
182
-
183
-
184
-
185
-
186
-
187
-
188
-
189
-
190
-
191
-
192
-
193
-
194
-
195
-
196
-
197
-
198
-
199
-
200
-
201
-
202
-
203
-
204
-
205
-
206
-
207
-
208
-
209
-
210
-
211
-
212
-
213
-
214
-
215
-
216
-
217
-
218
-
219
-
220
-
221
-
222
-
223
-
224
-
225
-
226
-
227
-
228
-
229
-
230
-
231
-
232
-
233
-
234
-
235
-
236
-
237
-
238
-
239
-
240
-
241
-
242
-
243
-
244
-
245
-
246
-
247
-
248
-
249
-
250
-
251
-
252
-
253
-
254
-
255
-
256
-
257
-
258
-
259
-
260
-
261
-
262
-
263
-
264
-
265
-
266
-
267
-
268
-
269
-
270
-
271
-
272
-
273
-
274
-
275
-
276
-
277
-
278
-
279
-
280
-
281
-
282
-
283
-
284
-
285
-
286
-
287
-
 288
288 -
 289
289 -
 290
290 -
 291
291 -
 292
292 -
 293
293 -
 294
294 -
 295
295 -
 296
296 -
 297
297 -
 298
298 -
 299
299 -
 300
300 -
 301
301 -
 302
302 -
 303
303 -
 304
304 -
 305
305 -
 306
306 -
 307
307 -
 308
308 -
309
-
310
-
311
-
312
-
313
-
314
-
315
-
316
-
317
-
318
-
319
-
320
-
321
-
322
-
323
-
324
-
325
-
326
-
327
-
328
-
329
-
330
-
331
-
332
-
333
-
334
-
335
-
336
-
337
-
338
-
339
-
340
-
341
-
342
-
343
-
344
 |
 |

6 To our shareholders 21 Corporate Governance 49 Combined management’s discussion and analysis
Asset measurement principles:
Management determined Assets as a measure to assess capital
intensity of the Sectors, Equity Investments and Siemens IT
Solutions and Services (Net capital employed). Its definition
corresponds to the Profit measure. It is based on Total assets of
the Consolidated Statements of Financial Position, primarily
excluding intragroup financing receivables, intragroup invest-
ments and tax related assets, since the corresponding posi-
tions are excluded from Profit. The remaining assets are re-
duced by non-interest-bearing liabilities other than tax related
liabilities (e.g. trade payables) and provisions to derive Assets.
Equity Investments include certain shareholder loans granted
to investments reported in Equity Investments, primarily NSN.
In contrast, Assets of SFS is Total assets. A reconciliation of
Assets disclosed in Segment Information to Total assets in the
Consolidated Statements of Financial Position is presented
below.
New orders:
New orders are determined principally as estimated revenue of
accepted purchase orders and order value changes and adjust-
ments, excluding letters of intent. New orders are supplemen-
tary information, provided on a voluntary basis. It is not part of
the audited Consolidated Financial Statements.
Free cash flow definition:
Segment Information discloses Free cash flow and Additions to
property, plant and equipment and intangible assets. Free cash
flow of the Sectors, Equity Investments, and Siemens IT Solu-
tions and Services constitutes net cash provided by (used in)
operating activities less additions to intangible assets and
property, plant and equipment. It excludes Financing interest
as well as income tax related and certain other payments and
proceeds, in accordance with the Company ’s Profit and Asset
measurement definition. Free cash flow of Equity Investments
includes interest from shareholder loans granted to invest-
ments reported in Equity Investments, primarily NSN. Pension
curtailments are a partial payback with regard to past service
costs that affect Segment Free cash flow. Free cash flow of SFS,
a financial services business, includes related financing inter-
est payments and proceeds; income tax payments and pro-
ceeds of SFS are excluded.
Amortization, depreciation and impairments:
Amortization, depreciation and impairments presented in Seg-
ment Information includes depreciation and impairments of
property, plant and equipment, net of reversals of impairments
as well as amortization and impairments of intangible assets,
net of reversals of impairment. Goodwill impairment is ex-
cluded.
Measurement –
Centrally managed portfolio activities and SRE
Centrally managed portfolio activities follow the measurement
principles of the Sectors. SRE applies the measurement prin-
ciples of SFS.
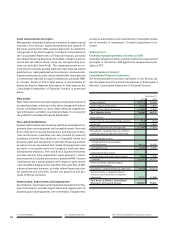
Reconciliation to Siemens’
Consolidated Financial Statements
The following table reconciles total Assets of the Sectors, Eq-
uity Investments and Cross-Sector Businesses to Total assets of
Siemens’ Consolidated Statements of Financial Position:
September,
Assets of Sectors 22,771 24,958
Assets of Equity Investments 3,319 3,833
Assets of Cross-Sector Businesses 12,356 11,945
Total Segment Assets 38,446 40,736
Reconciliation:
Assets Centrally managed portfolio activities (574) (543)
Assets SRE 5,067 4,489
Assets of Corporate items and pensions (10,447) (7,445)
Eliminations, Corporate Treasury and other
reconciling items of Segment Information:
Asset-based adjustments:
Intragroup financing receivables
and investments 24,813 28,083
Tax-related assets 4,625 3,771
Liability-based adjustments:
Pension plans and similar commitments 8,464 5,938
Liabilities 41,637 38,112
Assets classified as held for disposal
and associated liabilities – –
Eliminations, Corporate Treasury, other items (9,204) (18,215)
Total Eliminations, Corporate Treasury
and other reconciling items of Segment
Information 70,335 57,689
Total Assets in Siemens’ Consolidated
Statements of Financial Position 102,827 94,926