Siemens 2010 Annual Report Download - page 155
Download and view the complete annual report
Please find page 155 of the 2010 Siemens annual report below. You can navigate through the pages in the report by either clicking on the pages listed below, or by using the keyword search tool below to find specific information within the annual report.-
 1
1 -
2
-
3
-
4
-
5
-
6
-
7
-
8
-
9
-
10
-
11
-
12
-
13
-
14
-
15
-
16
-
17
-
18
-
19
-
20
-
21
-
22
-
23
-
24
-
25
-
26
-
27
-
28
-
29
-
30
-
31
-
32
-
33
-
34
-
35
-
36
-
37
-
38
-
39
-
40
-
41
-
42
-
43
-
44
-
45
-
46
-
47
-
48
-
49
-
50
-
51
-
52
-
53
-
54
-
55
-
56
-
57
-
58
-
59
-
60
-
61
-
62
-
63
-
64
-
65
-
66
-
67
-
68
-
69
-
70
-
71
-
72
-
73
-
74
-
75
-
76
-
77
-
78
-
79
-
80
-
81
-
82
-
83
-
84
-
85
-
86
-
87
-
88
-
89
-
90
-
91
-
92
-
93
-
94
-
95
-
96
-
97
-
98
-
99
-
100
-
101
-
102
-
103
-
104
-
105
-
106
-
107
-
108
-
109
-
110
-
111
-
112
-
113
-
114
-
115
-
116
-
117
-
118
-
119
-
120
-
121
-
122
-
123
-
124
-
125
-
126
-
127
-
128
-
129
-
130
-
131
-
132
-
133
-
134
-
135
-
136
-
137
-
138
-
139
-
140
-
141
-
142
-
143
-
144
-
 145
145 -
 146
146 -
 147
147 -
 148
148 -
 149
149 -
 150
150 -
 151
151 -
 152
152 -
 153
153 -
 154
154 -
 155
155 -
 156
156 -
 157
157 -
 158
158 -
 159
159 -
 160
160 -
 161
161 -
 162
162 -
 163
163 -
 164
164 -
 165
165 -
166
-
167
-
168
-
169
-
170
-
171
-
172
-
173
-
174
-
175
-
176
-
177
-
178
-
179
-
180
-
181
-
182
-
183
-
184
-
185
-
186
-
187
-
188
-
189
-
190
-
191
-
192
-
193
-
194
-
195
-
196
-
197
-
198
-
199
-
200
-
201
-
202
-
203
-
204
-
205
-
206
-
207
-
208
-
209
-
210
-
211
-
212
-
213
-
214
-
215
-
216
-
217
-
218
-
219
-
220
-
221
-
222
-
223
-
224
-
225
-
226
-
227
-
228
-
229
-
230
-
231
-
232
-
233
-
234
-
235
-
236
-
237
-
238
-
239
-
240
-
241
-
242
-
243
-
244
-
245
-
246
-
247
-
248
-
249
-
250
-
251
-
252
-
253
-
254
-
255
-
256
-
257
-
258
-
259
-
260
-
261
-
262
-
263
-
264
-
265
-
266
-
267
-
268
-
269
-
270
-
271
-
272
-
273
-
274
-
275
-
276
-
277
-
278
-
279
-
280
-
281
-
282
-
283
-
284
-
285
-
286
-
287
-
288
-
289
-
290
-
291
-
292
-
293
-
294
-
295
-
296
-
297
-
298
-
299
-
300
-
301
-
302
-
303
-
304
-
305
-
306
-
307
-
308
-
309
-
310
-
311
-
312
-
313
-
314
-
315
-
316
-
317
-
318
-
319
-
320
-
321
-
322
-
323
-
324
-
325
-
326
-
327
-
328
-
329
-
330
-
331
-
332
-
333
-
334
-
335
-
336
-
337
-
338
-
339
-
340
-
341
-
342
-
343
-
344
 |
 |

113 Report on post-balance sheet date events
114 Report on expected developments and associated
material opportunities and risks
128 Information required pursuant to § () and
§ () HGB and explanatory report
133 Information required pursuant to § () and
§ () no. HGB and explanatory report
135 Compensation and declaration pursuant to §a HGB
135 Additional information for supplemental
financial measures
138 Siemens AG (Discussion on basis of HGB)
147 Consolidated Financial Statements
261 Additional information
Energy
The Energy Sector executed particularly well in fiscal ,
increasing Sector profit % year-over-year, to €. billion,
despite a slight decline in full-year revenue compared to fiscal
and increased expenses for R&D, marketing and selling
associated with growth in the second half of fiscal . Profit
growth came primarily from Fossil Power Generation, due
mainly to strong project execution and a more favorable reve-
nue mix, and to a lesser extent from Power Transmission. The
Sector’s other Divisions each posted a modest profit decline
year-over-year.
Market conditions for Energy were difficult in the first half of
the current fiscal year, as customer postponements of large
infrastructure projects that began in fiscal continued into
fiscal . Conditions improved in the second half, particu-
larly including a strong pick-up in major orders. As a result,
fiscal orders for the Sector came in just above the prior-
year level, at €. billion. Orders climbed at all Divisions
except Fossil Power Generation, which saw significantly lower
volume from major orders in the first three quarters of the fis-
cal year. On a geographic basis, higher orders in the Americas
and Asia, Australia offset lower demand in Europe, C.I.S., Afri-
ca, Middle East. Revenue of €. billion was % lower than
the fiscal level, as a double-digit increase in revenue at
Renewable Energy nearly offset declines in the other Divisions.
On a geographic basis, revenue was up slightly in Europe,
C.I.S., Africa, Middle East, level in the Americas and lower in
Asia, Australia. On a book-to-bill ratio of ., the Sector’s order
backlog rose to € billion at the end of fiscal , up from
€ billion a year earlier. Out of the current backlog, orders of
€ billion are expected to be converted into revenue during
fiscal , orders of € billion during , and the remainder
in the periods thereafter.
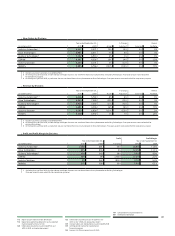
Sector
Year ended September , % Change therein
(in millions of €) Actual Adjusted Currency Portfolio
Profit 3,562 3,315 7%
Profit margin 14.0% 12.9%
New orders 30,122 30,076 0% (2)% 2% 0%
Total revenue 25,520 25,793 (1)% (4)% 2% 0%
External revenue 25,204 25,405 (1)%
therein:
Europe, C.I.S., Africa, Middle East 14,800 14,715 1%
therein Germany 2,118 1,905 11%
Americas 6,558 6,552 0%
Asia, Australia 3,847 4,138 (7)%
1 Excluding currency translation and portfolio effects. 2 Commonwealth of Independent States
New Orders by Divisions
Year ended September , % Change therein
(in millions of €) Actual Adjusted Currency Portfolio
Fossil Power Generation 9,920 12,135 (18)% (20)% 2% 0%
Renewable Energy 5,929 4,823 23% 22% 1% 0%
Oil & Gas 4,943 4,450 11% 7% 4% 0%
Power Transmission 6,770 6,324 7% 5% 2% 0%
Power Distribution 3,231 3,018 7% 4% 3% 0%
1 Excluding currency translation and portfolio effects.