Siemens 2010 Annual Report Download - page 148
Download and view the complete annual report
Please find page 148 of the 2010 Siemens annual report below. You can navigate through the pages in the report by either clicking on the pages listed below, or by using the keyword search tool below to find specific information within the annual report.-
 1
1 -
2
-
3
-
4
-
5
-
6
-
7
-
8
-
9
-
10
-
11
-
12
-
13
-
14
-
15
-
16
-
17
-
18
-
19
-
20
-
21
-
22
-
23
-
24
-
25
-
26
-
27
-
28
-
29
-
30
-
31
-
32
-
33
-
34
-
35
-
36
-
37
-
38
-
39
-
40
-
41
-
42
-
43
-
44
-
45
-
46
-
47
-
48
-
49
-
50
-
51
-
52
-
53
-
54
-
55
-
56
-
57
-
58
-
59
-
60
-
61
-
62
-
63
-
64
-
65
-
66
-
67
-
68
-
69
-
70
-
71
-
72
-
73
-
74
-
75
-
76
-
77
-
78
-
79
-
80
-
81
-
82
-
83
-
84
-
85
-
86
-
87
-
88
-
89
-
90
-
91
-
92
-
93
-
94
-
95
-
96
-
97
-
98
-
99
-
100
-
101
-
102
-
103
-
104
-
105
-
106
-
107
-
108
-
109
-
110
-
111
-
112
-
113
-
114
-
115
-
116
-
117
-
118
-
119
-
120
-
121
-
122
-
123
-
124
-
125
-
126
-
127
-
128
-
129
-
130
-
131
-
132
-
133
-
134
-
135
-
136
-
137
-
 138
138 -
 139
139 -
 140
140 -
 141
141 -
 142
142 -
 143
143 -
 144
144 -
 145
145 -
 146
146 -
 147
147 -
 148
148 -
 149
149 -
 150
150 -
 151
151 -
 152
152 -
 153
153 -
 154
154 -
 155
155 -
 156
156 -
 157
157 -
 158
158 -
159
-
160
-
161
-
162
-
163
-
164
-
165
-
166
-
167
-
168
-
169
-
170
-
171
-
172
-
173
-
174
-
175
-
176
-
177
-
178
-
179
-
180
-
181
-
182
-
183
-
184
-
185
-
186
-
187
-
188
-
189
-
190
-
191
-
192
-
193
-
194
-
195
-
196
-
197
-
198
-
199
-
200
-
201
-
202
-
203
-
204
-
205
-
206
-
207
-
208
-
209
-
210
-
211
-
212
-
213
-
214
-
215
-
216
-
217
-
218
-
219
-
220
-
221
-
222
-
223
-
224
-
225
-
226
-
227
-
228
-
229
-
230
-
231
-
232
-
233
-
234
-
235
-
236
-
237
-
238
-
239
-
240
-
241
-
242
-
243
-
244
-
245
-
246
-
247
-
248
-
249
-
250
-
251
-
252
-
253
-
254
-
255
-
256
-
257
-
258
-
259
-
260
-
261
-
262
-
263
-
264
-
265
-
266
-
267
-
268
-
269
-
270
-
271
-
272
-
273
-
274
-
275
-
276
-
277
-
278
-
279
-
280
-
281
-
282
-
283
-
284
-
285
-
286
-
287
-
288
-
289
-
290
-
291
-
292
-
293
-
294
-
295
-
296
-
297
-
298
-
299
-
300
-
301
-
302
-
303
-
304
-
305
-
306
-
307
-
308
-
309
-
310
-
311
-
312
-
313
-
314
-
315
-
316
-
317
-
318
-
319
-
320
-
321
-
322
-
323
-
324
-
325
-
326
-
327
-
328
-
329
-
330
-
331
-
332
-
333
-
334
-
335
-
336
-
337
-
338
-
339
-
340
-
341
-
342
-
343
-
344
 |
 |

6 To our shareholders 21 Corporate Governance 49 Combined management’s discussion and analysis
50 Business and operating environment
78 Fiscal – Financial summary
81 Results of operations
98 Financial position
110 Net assets position
113 Overall assessment of the economic position
included a higher volume from major orders in all Sectors. In
Asia, Australia, order intake benefited from positive currency
translation effects and came in % higher year-over-year, de-
spite significantly lower volume from major orders. Order in-
take in the region rose by double digits in the Healthcare Sec-
tor and to a lesser extent in Energy and Industry. The lower
volume from major orders mentioned above for the region
limited order growth in China and India. For comparison, the
prior year included a large contract win for high-speed trains
in China and major orders for Industry Solutions in India.
As previously disclosed, we have decided that, subject to the
exceptions outlined below, we will not enter into new con-
tracts with customers in Iran. Accordingly, we have issued
group-wide policies that establish the details of our general
decision. Under these policies, Siemens shall not tender fur-
ther bids for direct deliveries to customers in Iran. Further-
more, indirect deliveries from Siemens to Iran via external
third parties, including companies in which Siemens holds a
minority stake, are generally prohibited unless an exception is
specifically approved under certain circumstances. Notwith-
standing the foregoing, products and services for humanitari-
an purposes, including the products and services supplied by
our Healthcare Sector, and products and services required to
service the installed base (e.g., spare parts and maintenance
and assembly services) may still be provided under the poli-
cies. Finally, pre-existing commitments to customers in Iran
may be honored, i.e., legally binding obligations resulting from
agreements that existed, or bids that were submitted, before
the aforementioned policies were announced and adopted.
Although, over time, we expect our business activities in Iran
to decline as a result of the implementation of the new policies
and the related reduction of the number of new contracts, the
actual development of our revenues in the future will largely
depend on the timing and scope of customer requests to fulfill
pre-existing commitments. For additional information, see
“Report on expected developments and associated material
opportunities and risks – Risks.”
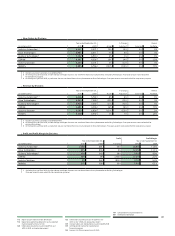
Revenue (location of customer)
Year ended September , % Change vs. previous year therein
(in millions of €) Actual Adjusted Currency Portfolio
Europe, C.I.S., Africa, Middle East 41,426 43,288 (4)% (5)% 1% (1)%
therein Germany 11,432 11,525 (1)% (1)% 0% 0%
Americas 20,643 20,754 (1)% (3)% 3% 0%
therein U.S. 14,772 15,684 (6)% (6)% 1% 0%
Asia, Australia 13,909 12,609 10% 5% 5% 0%
therein China 5,841 5,218 12% 10% 2% 0%
therein India 1,961 1,680 17% 9% 7% 0%
Siemens 75,978 76,651 (1)% (3)% 2% 0%
1 Excluding currency translation and portfolio effects. 2 Commonwealth of Independent States
New Orders and Revenue by quarter (in millions of €)
New Orders Revenue Book-to-bill ratio
Q4 10 23,473 Q4 10 21,229 1.11
Q3 10 20,871 Q3 10 19,170 1.09
Q2 10 17,844 Q2 10 18,227 0.98
Q1 10 18,976 Q1 10 17,352 1.09
Q4 09 18,747 Q4 09 19,714 0.95
Q3 09 17,160 Q3 09 18,348 0.94
Q2 09 20,864 Q2 09 18,955 1.10
Q1 09 22,220 Q1 09 19,634 1.13