Siemens 2010 Annual Report Download - page 158
Download and view the complete annual report
Please find page 158 of the 2010 Siemens annual report below. You can navigate through the pages in the report by either clicking on the pages listed below, or by using the keyword search tool below to find specific information within the annual report.-
 1
1 -
2
-
3
-
4
-
5
-
6
-
7
-
8
-
9
-
10
-
11
-
12
-
13
-
14
-
15
-
16
-
17
-
18
-
19
-
20
-
21
-
22
-
23
-
24
-
25
-
26
-
27
-
28
-
29
-
30
-
31
-
32
-
33
-
34
-
35
-
36
-
37
-
38
-
39
-
40
-
41
-
42
-
43
-
44
-
45
-
46
-
47
-
48
-
49
-
50
-
51
-
52
-
53
-
54
-
55
-
56
-
57
-
58
-
59
-
60
-
61
-
62
-
63
-
64
-
65
-
66
-
67
-
68
-
69
-
70
-
71
-
72
-
73
-
74
-
75
-
76
-
77
-
78
-
79
-
80
-
81
-
82
-
83
-
84
-
85
-
86
-
87
-
88
-
89
-
90
-
91
-
92
-
93
-
94
-
95
-
96
-
97
-
98
-
99
-
100
-
101
-
102
-
103
-
104
-
105
-
106
-
107
-
108
-
109
-
110
-
111
-
112
-
113
-
114
-
115
-
116
-
117
-
118
-
119
-
120
-
121
-
122
-
123
-
124
-
125
-
126
-
127
-
128
-
129
-
130
-
131
-
132
-
133
-
134
-
135
-
136
-
137
-
138
-
139
-
140
-
141
-
142
-
143
-
144
-
145
-
146
-
147
-
 148
148 -
 149
149 -
 150
150 -
 151
151 -
 152
152 -
 153
153 -
 154
154 -
 155
155 -
 156
156 -
 157
157 -
 158
158 -
 159
159 -
 160
160 -
 161
161 -
 162
162 -
 163
163 -
 164
164 -
 165
165 -
 166
166 -
 167
167 -
 168
168 -
169
-
170
-
171
-
172
-
173
-
174
-
175
-
176
-
177
-
178
-
179
-
180
-
181
-
182
-
183
-
184
-
185
-
186
-
187
-
188
-
189
-
190
-
191
-
192
-
193
-
194
-
195
-
196
-
197
-
198
-
199
-
200
-
201
-
202
-
203
-
204
-
205
-
206
-
207
-
208
-
209
-
210
-
211
-
212
-
213
-
214
-
215
-
216
-
217
-
218
-
219
-
220
-
221
-
222
-
223
-
224
-
225
-
226
-
227
-
228
-
229
-
230
-
231
-
232
-
233
-
234
-
235
-
236
-
237
-
238
-
239
-
240
-
241
-
242
-
243
-
244
-
245
-
246
-
247
-
248
-
249
-
250
-
251
-
252
-
253
-
254
-
255
-
256
-
257
-
258
-
259
-
260
-
261
-
262
-
263
-
264
-
265
-
266
-
267
-
268
-
269
-
270
-
271
-
272
-
273
-
274
-
275
-
276
-
277
-
278
-
279
-
280
-
281
-
282
-
283
-
284
-
285
-
286
-
287
-
288
-
289
-
290
-
291
-
292
-
293
-
294
-
295
-
296
-
297
-
298
-
299
-
300
-
301
-
302
-
303
-
304
-
305
-
306
-
307
-
308
-
309
-
310
-
311
-
312
-
313
-
314
-
315
-
316
-
317
-
318
-
319
-
320
-
321
-
322
-
323
-
324
-
325
-
326
-
327
-
328
-
329
-
330
-
331
-
332
-
333
-
334
-
335
-
336
-
337
-
338
-
339
-
340
-
341
-
342
-
343
-
344
 |
 |

6 To our shareholders 21 Corporate Governance 49 Combined management’s discussion and analysis
50 Business and operating environment
78 Fiscal – Financial summary
81 Results of operations
98 Financial position
110 Net assets position
113 Overall assessment of the economic position
Profit at Imaging & IT increased % to €. billion in the
prior year, on higher revenue, a favorable product mix and
continued cost savings. The increase in profit year-over-year
benefited from positive effects related to currency develop-
ment, including an unfavorable currency hedge in the prior
year. In addition, profit in the current period benefited from
€ million of the pension gain mentioned above for the Sec-
tor. Orders climbed % year-over-year and revenue increased
%. As for the whole Sector, orders at Imaging & IT showed
strong growth in the Americas and Asia, Australia, while orders
at Europe, C.I.S., Africa, Middle East remained stable. Double-
digit revenue growth in Asia, Australia included strong in-
creases in Japan, China and India. On an organic basis, orders
climbed % and revenue rose %.
Workflow & Solutions generated € million in profit com-
pared to a loss of € million a year earlier. Both periods under
review included charges associated with particle therapy con-
tracts mentioned above, totaling € million in fiscal and
€ million in fiscal . The charges stemmed from tests of
prototype technology, resulting in a revised assessment of the
additional costs required to complete the projects. Orders in
fiscal came in % below the prior-year level. Revenue was
stable year-over-year.
Diagnostics
posted a loss of € million in fiscal com-
pared to profit of € million a year earlier, due primarily to
the impairment charges mentioned above. During the fourth
quarter, Siemens completed a strategic review which reas-
sessed the medium-term growth prospects and long-term
market development of the laboratory diagnostics business,
and also conducted correspondingly an annual impairment
test. The impairment charges of €. billion included €.
billion for goodwill and € million for real estate. For further
information regarding goodwill at Diagnostics, refer to “Net
Assets Position” and see also “Notes to Consolidated Financial
Statements.” The Division recorded lower expenses related to
SG&A, and results also benefited from € million of the pen-
sion curtailment gain mentioned above. PPA effects related to
past acquisitions were € million in fiscal . In addition,
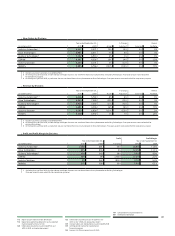
New Orders by Divisions
Year ended September , % Change therein
(in millions of €) Actual Adjusted Currency Portfolio
Imaging & IT 7,961 7,143 11% 9% 3% 0%
Workflow & Solutions 1,498 1,553 (4)% (6)% 3% 0%
Diagnostics 3,664 3,479 5% 3% 3% 0%
1 Excluding currency translation and portfolio effects.
Revenue by Divisions
Year ended September , % Change therein
(in millions of €) Actual Adjusted Currency Portfolio
Imaging & IT 7,419 7,152 4% 2% 2% 0%
Workflow & Solutions 1,522 1,515 0% (2)% 2% 0%
Diagnostics 3,667 3,490 5% 2% 3% 0%
1 Excluding currency translation and portfolio effects.
Profit and Profit Margin by Divisions
Profit Profit Margin
Year ended September , Year ended September ,
(in millions of €) % Change
Imaging & IT 1,452 1,161 25% 19.6% 16.2%
Workflow & Solutions 27 (53) – 1.8% (3.5)%
Diagnostics (776) 338 – (21.2)% 9.7%