Siemens 2010 Annual Report Download - page 156
Download and view the complete annual report
Please find page 156 of the 2010 Siemens annual report below. You can navigate through the pages in the report by either clicking on the pages listed below, or by using the keyword search tool below to find specific information within the annual report.-
 1
1 -
2
-
3
-
4
-
5
-
6
-
7
-
8
-
9
-
10
-
11
-
12
-
13
-
14
-
15
-
16
-
17
-
18
-
19
-
20
-
21
-
22
-
23
-
24
-
25
-
26
-
27
-
28
-
29
-
30
-
31
-
32
-
33
-
34
-
35
-
36
-
37
-
38
-
39
-
40
-
41
-
42
-
43
-
44
-
45
-
46
-
47
-
48
-
49
-
50
-
51
-
52
-
53
-
54
-
55
-
56
-
57
-
58
-
59
-
60
-
61
-
62
-
63
-
64
-
65
-
66
-
67
-
68
-
69
-
70
-
71
-
72
-
73
-
74
-
75
-
76
-
77
-
78
-
79
-
80
-
81
-
82
-
83
-
84
-
85
-
86
-
87
-
88
-
89
-
90
-
91
-
92
-
93
-
94
-
95
-
96
-
97
-
98
-
99
-
100
-
101
-
102
-
103
-
104
-
105
-
106
-
107
-
108
-
109
-
110
-
111
-
112
-
113
-
114
-
115
-
116
-
117
-
118
-
119
-
120
-
121
-
122
-
123
-
124
-
125
-
126
-
127
-
128
-
129
-
130
-
131
-
132
-
133
-
134
-
135
-
136
-
137
-
138
-
139
-
140
-
141
-
142
-
143
-
144
-
145
-
 146
146 -
 147
147 -
 148
148 -
 149
149 -
 150
150 -
 151
151 -
 152
152 -
 153
153 -
 154
154 -
 155
155 -
 156
156 -
 157
157 -
 158
158 -
 159
159 -
 160
160 -
 161
161 -
 162
162 -
 163
163 -
 164
164 -
 165
165 -
 166
166 -
167
-
168
-
169
-
170
-
171
-
172
-
173
-
174
-
175
-
176
-
177
-
178
-
179
-
180
-
181
-
182
-
183
-
184
-
185
-
186
-
187
-
188
-
189
-
190
-
191
-
192
-
193
-
194
-
195
-
196
-
197
-
198
-
199
-
200
-
201
-
202
-
203
-
204
-
205
-
206
-
207
-
208
-
209
-
210
-
211
-
212
-
213
-
214
-
215
-
216
-
217
-
218
-
219
-
220
-
221
-
222
-
223
-
224
-
225
-
226
-
227
-
228
-
229
-
230
-
231
-
232
-
233
-
234
-
235
-
236
-
237
-
238
-
239
-
240
-
241
-
242
-
243
-
244
-
245
-
246
-
247
-
248
-
249
-
250
-
251
-
252
-
253
-
254
-
255
-
256
-
257
-
258
-
259
-
260
-
261
-
262
-
263
-
264
-
265
-
266
-
267
-
268
-
269
-
270
-
271
-
272
-
273
-
274
-
275
-
276
-
277
-
278
-
279
-
280
-
281
-
282
-
283
-
284
-
285
-
286
-
287
-
288
-
289
-
290
-
291
-
292
-
293
-
294
-
295
-
296
-
297
-
298
-
299
-
300
-
301
-
302
-
303
-
304
-
305
-
306
-
307
-
308
-
309
-
310
-
311
-
312
-
313
-
314
-
315
-
316
-
317
-
318
-
319
-
320
-
321
-
322
-
323
-
324
-
325
-
326
-
327
-
328
-
329
-
330
-
331
-
332
-
333
-
334
-
335
-
336
-
337
-
338
-
339
-
340
-
341
-
342
-
343
-
344
 |
 |

6 To our shareholders 21 Corporate Governance 49 Combined management’s discussion and analysis
50 Business and operating environment
78 Fiscal – Financial summary
81 Results of operations
98 Financial position
110 Net assets position
113 Overall assessment of the economic position
Fossil Power Generation again led all Siemens Divisions with
€. billion in profit in fiscal . Drivers of the % increase
year-over-year included strong project execution and a more
favorable revenue mix, including a higher contribution from
the service business. Charges of € million for capacity adjust-
ments related to a shift of production capacity within the
Americas region were partly offset by the Division’s share in
the pension curtailment gain. Order development at Fossil
Power Generation was heavily influenced by market contrac-
tion in the first three quarters of the fiscal year, including the
drop in major orders mentioned above. Strong demand in the
fourth quarter limited the Division’s order decline to % for
the full year. In contrast, revenue development throughout the
year remained relatively stable due to Fossil Power Genera-
tion’s strong order backlog, and revenue came in % below the
prior-year period.
Profit at Renewable Energy declined % compared to fiscal
, to € million, after significant expenses and invest-
ments to expand the Division’s wind business and build up its
solar business, including transaction and integration costs re-
lated to consolidation of the solar company Solel. These trans-
action and integration costs, in combination with negative
operating results, resulted in a net loss related to the acquired
Solel business in fiscal . After a seasonally low first quar-
ter, revenue rose in each of the next three quarters, both year-
over-year and on a consecutive basis, resulting in an % in-
crease for the full year. As in past years, order development
was more volatile from quarter to quarter than revenue
growth. The Division continued to win large wind-farm orders
in Europe and the Americas and generated a % increase in
new orders for the full fiscal year. Renewable Energy expects
impacts on profitability in the first half of fiscal related to
the build-up of its solar business and seasonal effects in the
wind business.
Profit at Oil & Gas came in % lower year-over-year, at € mil-
lion. The main factor in the change was a % decline in revenue
coming primarily from the Division’s compression and solu-
tions business. Orders rose steadily throughout the fiscal year
and came in % higher year-over-year, including strong de-
mand at the industrial turbines business.
Power Transmission recorded a % increase in profit, to €
million. While profit was held back in part by pricing pressure
due mainly to new market entrants, the Division benefited
from a positive swing in effects from commodity hedging and
also improved its project performance compared to the prior
year. Starting from a relatively low level in the first quarter of
fiscal , the Division increased its revenue steadily through-
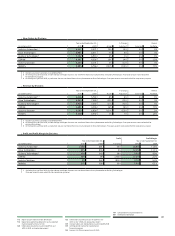
Revenue by Divisions
Year ended September , % Change therein
(in millions of €) Actual Adjusted Currency Portfolio
Fossil Power Generation 9,550 9,802 (3)% (3)% 1% 0%
Renewable Energy 3,272 2,935 11% 5% 3% 3%
Oil & Gas 4,156 4,276 (3)% (6)% 4% 0%
Power Transmission 6,143 6,172 0% (4)% 3% 0%
Power Distribution 3,039 3,284 (7)% (10)% 3% 0%
1 Excluding currency translation and portfolio effects.
Profit and Profit Margin by Divisions
Profit Profit Margin
Year ended September , Year ended September ,
(in millions of €) % Change
Fossil Power Generation 1,516 1,275 19% 15.9% 13.0%
Renewable Energy 368 382 (4)% 11.3% 13.0%
Oil & Gas 487 499 (2)% 11.7% 11.7%
Power Transmission 763 725 5% 12.4% 11.7%
Power Distribution 422 435 (3)% 13.9% 13.2%