Siemens 2010 Annual Report Download - page 146
Download and view the complete annual report
Please find page 146 of the 2010 Siemens annual report below. You can navigate through the pages in the report by either clicking on the pages listed below, or by using the keyword search tool below to find specific information within the annual report.-
 1
1 -
2
-
3
-
4
-
5
-
6
-
7
-
8
-
9
-
10
-
11
-
12
-
13
-
14
-
15
-
16
-
17
-
18
-
19
-
20
-
21
-
22
-
23
-
24
-
25
-
26
-
27
-
28
-
29
-
30
-
31
-
32
-
33
-
34
-
35
-
36
-
37
-
38
-
39
-
40
-
41
-
42
-
43
-
44
-
45
-
46
-
47
-
48
-
49
-
50
-
51
-
52
-
53
-
54
-
55
-
56
-
57
-
58
-
59
-
60
-
61
-
62
-
63
-
64
-
65
-
66
-
67
-
68
-
69
-
70
-
71
-
72
-
73
-
74
-
75
-
76
-
77
-
78
-
79
-
80
-
81
-
82
-
83
-
84
-
85
-
86
-
87
-
88
-
89
-
90
-
91
-
92
-
93
-
94
-
95
-
96
-
97
-
98
-
99
-
100
-
101
-
102
-
103
-
104
-
105
-
106
-
107
-
108
-
109
-
110
-
111
-
112
-
113
-
114
-
115
-
116
-
117
-
118
-
119
-
120
-
121
-
122
-
123
-
124
-
125
-
126
-
127
-
128
-
129
-
130
-
131
-
132
-
133
-
134
-
135
-
 136
136 -
 137
137 -
 138
138 -
 139
139 -
 140
140 -
 141
141 -
 142
142 -
 143
143 -
 144
144 -
 145
145 -
 146
146 -
 147
147 -
 148
148 -
 149
149 -
 150
150 -
 151
151 -
 152
152 -
 153
153 -
 154
154 -
 155
155 -
 156
156 -
157
-
158
-
159
-
160
-
161
-
162
-
163
-
164
-
165
-
166
-
167
-
168
-
169
-
170
-
171
-
172
-
173
-
174
-
175
-
176
-
177
-
178
-
179
-
180
-
181
-
182
-
183
-
184
-
185
-
186
-
187
-
188
-
189
-
190
-
191
-
192
-
193
-
194
-
195
-
196
-
197
-
198
-
199
-
200
-
201
-
202
-
203
-
204
-
205
-
206
-
207
-
208
-
209
-
210
-
211
-
212
-
213
-
214
-
215
-
216
-
217
-
218
-
219
-
220
-
221
-
222
-
223
-
224
-
225
-
226
-
227
-
228
-
229
-
230
-
231
-
232
-
233
-
234
-
235
-
236
-
237
-
238
-
239
-
240
-
241
-
242
-
243
-
244
-
245
-
246
-
247
-
248
-
249
-
250
-
251
-
252
-
253
-
254
-
255
-
256
-
257
-
258
-
259
-
260
-
261
-
262
-
263
-
264
-
265
-
266
-
267
-
268
-
269
-
270
-
271
-
272
-
273
-
274
-
275
-
276
-
277
-
278
-
279
-
280
-
281
-
282
-
283
-
284
-
285
-
286
-
287
-
288
-
289
-
290
-
291
-
292
-
293
-
294
-
295
-
296
-
297
-
298
-
299
-
300
-
301
-
302
-
303
-
304
-
305
-
306
-
307
-
308
-
309
-
310
-
311
-
312
-
313
-
314
-
315
-
316
-
317
-
318
-
319
-
320
-
321
-
322
-
323
-
324
-
325
-
326
-
327
-
328
-
329
-
330
-
331
-
332
-
333
-
334
-
335
-
336
-
337
-
338
-
339
-
340
-
341
-
342
-
343
-
344
 |
 |

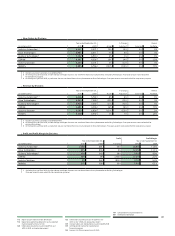
6 To our shareholders 21 Corporate Governance 49 Combined management’s discussion and analysis
50 Business and operating environment
78 Fiscal – Financial summary
81 Results of operations
98 Financial position
110 Net assets position
113 Overall assessment of the economic position
in these payments in fiscal . In contrast, fiscal in-
cluded higher cash outflows related to income taxes and pen-
sion plans. For comparison, negative changes in net working
capital in fiscal included €. billion in cash outflows
for payments to authorities in the U.S. and Germany following
resolution of legal proceedings, and substantial cash outflows
stemming from project charges at Fossil Power Generation,
Mobility and Siemens IT Solutions and Services. The impair-
ment charges at Diagnostics and NSN mentioned above had no
cash impact in the periods under review. Free cash flow in both
periods included approximately €. billion in outflows related
to staff reduction measures.
We increased our capital efficiency. Return on capital em-
ployed (ROCE) improved on a continuing basis to .% from
.% in the prior year. The difference was due primarily to
higher income from continuing operations and, to a lesser
extent, to a decline in average capital employed year-over-year.
ROCE in both fiscal years was held back by the burdens already
mentioned above for income from continuing operations. In
the current year, the pre-tax impairment charges of €. bil-
lion at Diagnostics and the € million in pre-tax charges re-
lated to Siemens IT Solutions and Services represented .
percentage points of ROCE, while the €. billion in pre-tax
impairment charges related to NSN in the prior year repre-
sented . percentage points.
We propose to increase the dividend.
The Siemens Managing
Board and Supervisory Board propose a dividend of €. per
share. The prior-year dividend was €. per share.
Dividend per share (in €)
FY 2.70 1
FY 1.60
FY 1.60
FY 1.60
FY 1.45
1 Proposed by the Managing Board in agreement with the Supervisory Board;
to be approved by the shareholders at the Annual Shareholders’ Meeting on
January 25, 2011.
Free cash flow (in millions of €)
Total Sectors Continuing operations Continuing and dis-
continued operations
FY 2010 FY 2009
3,7867,111 3,641
7,013
10,934 7,606
44%
88% 93%