Siemens 2010 Annual Report Download - page 153
Download and view the complete annual report
Please find page 153 of the 2010 Siemens annual report below. You can navigate through the pages in the report by either clicking on the pages listed below, or by using the keyword search tool below to find specific information within the annual report.-
 1
1 -
2
-
3
-
4
-
5
-
6
-
7
-
8
-
9
-
10
-
11
-
12
-
13
-
14
-
15
-
16
-
17
-
18
-
19
-
20
-
21
-
22
-
23
-
24
-
25
-
26
-
27
-
28
-
29
-
30
-
31
-
32
-
33
-
34
-
35
-
36
-
37
-
38
-
39
-
40
-
41
-
42
-
43
-
44
-
45
-
46
-
47
-
48
-
49
-
50
-
51
-
52
-
53
-
54
-
55
-
56
-
57
-
58
-
59
-
60
-
61
-
62
-
63
-
64
-
65
-
66
-
67
-
68
-
69
-
70
-
71
-
72
-
73
-
74
-
75
-
76
-
77
-
78
-
79
-
80
-
81
-
82
-
83
-
84
-
85
-
86
-
87
-
88
-
89
-
90
-
91
-
92
-
93
-
94
-
95
-
96
-
97
-
98
-
99
-
100
-
101
-
102
-
103
-
104
-
105
-
106
-
107
-
108
-
109
-
110
-
111
-
112
-
113
-
114
-
115
-
116
-
117
-
118
-
119
-
120
-
121
-
122
-
123
-
124
-
125
-
126
-
127
-
128
-
129
-
130
-
131
-
132
-
133
-
134
-
135
-
136
-
137
-
138
-
139
-
140
-
141
-
142
-
 143
143 -
 144
144 -
 145
145 -
 146
146 -
 147
147 -
 148
148 -
 149
149 -
 150
150 -
 151
151 -
 152
152 -
 153
153 -
 154
154 -
 155
155 -
 156
156 -
 157
157 -
 158
158 -
 159
159 -
 160
160 -
 161
161 -
 162
162 -
 163
163 -
164
-
165
-
166
-
167
-
168
-
169
-
170
-
171
-
172
-
173
-
174
-
175
-
176
-
177
-
178
-
179
-
180
-
181
-
182
-
183
-
184
-
185
-
186
-
187
-
188
-
189
-
190
-
191
-
192
-
193
-
194
-
195
-
196
-
197
-
198
-
199
-
200
-
201
-
202
-
203
-
204
-
205
-
206
-
207
-
208
-
209
-
210
-
211
-
212
-
213
-
214
-
215
-
216
-
217
-
218
-
219
-
220
-
221
-
222
-
223
-
224
-
225
-
226
-
227
-
228
-
229
-
230
-
231
-
232
-
233
-
234
-
235
-
236
-
237
-
238
-
239
-
240
-
241
-
242
-
243
-
244
-
245
-
246
-
247
-
248
-
249
-
250
-
251
-
252
-
253
-
254
-
255
-
256
-
257
-
258
-
259
-
260
-
261
-
262
-
263
-
264
-
265
-
266
-
267
-
268
-
269
-
270
-
271
-
272
-
273
-
274
-
275
-
276
-
277
-
278
-
279
-
280
-
281
-
282
-
283
-
284
-
285
-
286
-
287
-
288
-
289
-
290
-
291
-
292
-
293
-
294
-
295
-
296
-
297
-
298
-
299
-
300
-
301
-
302
-
303
-
304
-
305
-
306
-
307
-
308
-
309
-
310
-
311
-
312
-
313
-
314
-
315
-
316
-
317
-
318
-
319
-
320
-
321
-
322
-
323
-
324
-
325
-
326
-
327
-
328
-
329
-
330
-
331
-
332
-
333
-
334
-
335
-
336
-
337
-
338
-
339
-
340
-
341
-
342
-
343
-
344
 |
 |

113 Report on post-balance sheet date events
114 Report on expected developments and associated
material opportunities and risks
128 Information required pursuant to § () and
§ () HGB and explanatory report
133 Information required pursuant to § () and
§ () no. HGB and explanatory report
135 Compensation and declaration pursuant to §a HGB
135 Additional information for supplemental
financial measures
138 Siemens AG (Discussion on basis of HGB)
147 Consolidated Financial Statements
261 Additional information
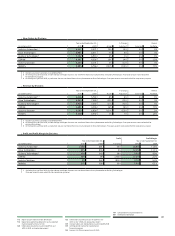
New Orders by Divisions
Year ended September , % Change therein
(in millions of €) Actual Adjusted Currency Portfolio
Industry Automation , 6,421 5,571 15% 13% 2% 0%
Drive Technologies 6,981 6,511 7% 5% 2% 0%
Building Technologies 7,132 6,910 3% 1% 3% 0%
OSRAM 4,681 4,036 16% 14% 3% (1)%
Industry Solutions 6,203 6,101 2% (1)% 3% 0%
Mobility 5,885 6,766 (13)% (14)% 2% (1)%
1 Excluding currency translation and portfolio effects.
At the beginning of fiscal , the low-voltage switchgear business was transferred from Industry Automation to Building Technologies. Prior-year amounts were reclassified
for comparison purposes.
At the beginning of fiscal , a production site was transferred from Industry Automation to Drive Technologies. Prior-year amounts were reclassified for comparison purposes.
Revenue by Divisions
Year ended September , % Change therein
(in millions of €) Actual Adjusted Currency Portfolio
Industry Automation , 6,226 5,763 8% 6% 2% 0%
Drive Technologies 6,960 7,526 (8)% (9)% 2% 0%
Building Technologies 6,903 7,007 (1)% (3)% 2% 0%
OSRAM 4,681 4,036 16% 14% 3% (1)%
Industry Solutions 6,040 6,804 (11)% (13)% 2% 0%
Mobility 6,508 6,442 1% 1% 2% (2)%
1 Excluding currency translation and portfolio effects.
At the beginning of fiscal , the low-voltage switchgear business was transferred from Industry Automation to Building Technologies. Prior-year amounts were reclassified for
comparison purposes.
At the beginning of fiscal , a production site was transferred from Industry Automation to Drive Technologies. Prior-year amounts were reclassified for comparison purposes.
Profit and Profit Margin by Divisions
Profit Profit Margin
Year ended September , Year ended September ,
(in millions of €) % Change
Industry Automation 1,048 681 54% 16.8% 11.8%
Drive Technologies 855 836 2% 12.3% 11.1%
Building Technologies 456 340 34% 6.6% 4.9%
OSRAM 569 89 >200% 12.2% 2.2%
Industry Solutions 39 360 (89)% 0.7% 5.3%
Mobility 513 390 32% 7.9% 6.1%
1 At the beginning of fiscal , the low-voltage switchgear business was transferred from Industry Automation to Building Technologies.
Prior-year amounts were reclassified for comparison purposes.