Siemens 2010 Annual Report Download - page 289
Download and view the complete annual report
Please find page 289 of the 2010 Siemens annual report below. You can navigate through the pages in the report by either clicking on the pages listed below, or by using the keyword search tool below to find specific information within the annual report.-
 1
1 -
2
-
3
-
4
-
5
-
6
-
7
-
8
-
9
-
10
-
11
-
12
-
13
-
14
-
15
-
16
-
17
-
18
-
19
-
20
-
21
-
22
-
23
-
24
-
25
-
26
-
27
-
28
-
29
-
30
-
31
-
32
-
33
-
34
-
35
-
36
-
37
-
38
-
39
-
40
-
41
-
42
-
43
-
44
-
45
-
46
-
47
-
48
-
49
-
50
-
51
-
52
-
53
-
54
-
55
-
56
-
57
-
58
-
59
-
60
-
61
-
62
-
63
-
64
-
65
-
66
-
67
-
68
-
69
-
70
-
71
-
72
-
73
-
74
-
75
-
76
-
77
-
78
-
79
-
80
-
81
-
82
-
83
-
84
-
85
-
86
-
87
-
88
-
89
-
90
-
91
-
92
-
93
-
94
-
95
-
96
-
97
-
98
-
99
-
100
-
101
-
102
-
103
-
104
-
105
-
106
-
107
-
108
-
109
-
110
-
111
-
112
-
113
-
114
-
115
-
116
-
117
-
118
-
119
-
120
-
121
-
122
-
123
-
124
-
125
-
126
-
127
-
128
-
129
-
130
-
131
-
132
-
133
-
134
-
135
-
136
-
137
-
138
-
139
-
140
-
141
-
142
-
143
-
144
-
145
-
146
-
147
-
148
-
149
-
150
-
151
-
152
-
153
-
154
-
155
-
156
-
157
-
158
-
159
-
160
-
161
-
162
-
163
-
164
-
165
-
166
-
167
-
168
-
169
-
170
-
171
-
172
-
173
-
174
-
175
-
176
-
177
-
178
-
179
-
180
-
181
-
182
-
183
-
184
-
185
-
186
-
187
-
188
-
189
-
190
-
191
-
192
-
193
-
194
-
195
-
196
-
197
-
198
-
199
-
200
-
201
-
202
-
203
-
204
-
205
-
206
-
207
-
208
-
209
-
210
-
211
-
212
-
213
-
214
-
215
-
216
-
217
-
218
-
219
-
220
-
221
-
222
-
223
-
224
-
225
-
226
-
227
-
228
-
229
-
230
-
231
-
232
-
233
-
234
-
235
-
236
-
237
-
238
-
239
-
240
-
241
-
242
-
243
-
244
-
245
-
246
-
247
-
248
-
249
-
250
-
251
-
252
-
253
-
254
-
255
-
256
-
257
-
258
-
259
-
260
-
261
-
262
-
263
-
264
-
265
-
266
-
267
-
268
-
269
-
270
-
271
-
272
-
273
-
274
-
275
-
276
-
277
-
278
-
 279
279 -
 280
280 -
 281
281 -
 282
282 -
 283
283 -
 284
284 -
 285
285 -
 286
286 -
 287
287 -
 288
288 -
 289
289 -
 290
290 -
 291
291 -
 292
292 -
 293
293 -
 294
294 -
 295
295 -
 296
296 -
 297
297 -
 298
298 -
 299
299 -
300
-
301
-
302
-
303
-
304
-
305
-
306
-
307
-
308
-
309
-
310
-
311
-
312
-
313
-
314
-
315
-
316
-
317
-
318
-
319
-
320
-
321
-
322
-
323
-
324
-
325
-
326
-
327
-
328
-
329
-
330
-
331
-
332
-
333
-
334
-
335
-
336
-
337
-
338
-
339
-
340
-
341
-
342
-
343
-
344
 |
 |

147 Consolidated Financial Statements
148 Consolidated Statements of Income
149 Consolidated Statements of Comprehensive Income
150 Consolidated Statements of Financial Position
151 Consolidated Statements of Cash Flow
152 Consolidated Statements of Changes in Equity
154 Notes to Consolidated Financial Statements
(in millions of €, except where otherwise stated
and per share amounts)
261 Additional information
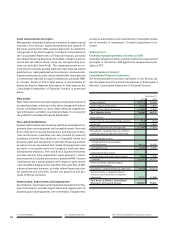
nancial liabilities (including interest) without fixed amount or
timing are based on the conditions existing at September ,
.
Year ended September ,
to
and
thereafter
Non-derivative
financial liabilities
Notes and bonds 2,778 3,166 4,588 9,874
Loans from banks 328 46 2,026 13
Other financial
indebtedness 27 21 63 38
Obligations under
finance leases 57 21 41 73
Trade payables 7,880 12 5 2
Other financial liabilities 499 59 85 9
Derivative financial
liabilities 535 296 222 56
The risk implied from the values shown in the table above,
reflects the one-sided scenario of cash outflows only. Obliga-
tions under finance leases, trade payables and other financial
liabilities mainly originate from the financing of assets used in
our ongoing operations such as property, plant, equipment
and investments in working capital – e.g. inventories and trade
receivables. These assets are considered in the Company ’s
overall liquidity risk management. To monitor existing finan-
cial assets and liabilities as well as to enable an effective con-
trolling of future risks, Siemens has established a comprehen-
sive risk reporting covering its worldwide business units.
The balanced view of liquidity and financial indebtedness is
stated in the calculation of the Net debt.
Net debt
results from
total debt less total liquidity. Total debt comprises Short-term
debt and current maturities of long-term debt as well as Long-
term debt, as stated on the Consolidated Statements of Finan-
cial Position. Total debt comprises Notes and bonds, Loans
from banks, Obligations under finance leases and Other finan-
cial indebtedness such as commercial paper. Total liquidity
refers to the liquid financial assets we had available at the re-
spective period-end dates to fund our business operations and
to pay for near-term obligations. Total liquidity comprises Cash
and cash equivalents as well as current Available-for-sale fi-
nancial assets, as stated on the Consolidated Statements of
Financial Position. Management uses the Net debt measure for
internal corporate finance management, as well as for external
communication with investors, analysts and rating agencies.
September ,
Short-term debt and current
maturities of long-term debt 2,416 698
Long-term debt 17,497 18,940
Total debt 19,913 19,638
Cash and cash equivalents 14,108 10,159
Available-for-sale financial assets 246 170
Total liquidity 14,354 10,329
Net debt (Total debt less Total liquidity) 5,560 9,309
Siemens’
capital resources
consist of a variety of short- and
long-term financial instruments including, but not limited to,
loans from financial institutions, commercial paper, medium-
term notes and bonds. In addition, other capital resources
consist of liquid resources such as Cash and cash equivalents,
future cash flows from operating activities and current Avail-
able-for-sale financial assets.
Siemens’
capital requirements
include, among others, sched-
uled debt service, regular capital spending, ongoing cash re-
quirements from operating, Corporate Treasury and SFS fi-
nancing activities, dividend payments, pension plan funding,
portfolio activities and cash outflows in connection with re-
structuring measures.
Credit risk
The Company is exposed to credit risk especially in connection
with its significant project business mainly in its Sectors and
also in some Cross-Sector business fields as public infrastruc-
ture and transport, power generation and transmission,
healthcare, utilities and IT, where direct or indirect financing in
various forms may be provided to customers. In limited cases,
the Company may also take an equity interest as part of the
project financing.
The Company is also exposed to credit risk via its financing
activities, primarily related to medical engineering, data pro-
cessing equipment and industrial products of third party
manufacturers.