Siemens 2010 Annual Report Download - page 160
Download and view the complete annual report
Please find page 160 of the 2010 Siemens annual report below. You can navigate through the pages in the report by either clicking on the pages listed below, or by using the keyword search tool below to find specific information within the annual report.-
 1
1 -
2
-
3
-
4
-
5
-
6
-
7
-
8
-
9
-
10
-
11
-
12
-
13
-
14
-
15
-
16
-
17
-
18
-
19
-
20
-
21
-
22
-
23
-
24
-
25
-
26
-
27
-
28
-
29
-
30
-
31
-
32
-
33
-
34
-
35
-
36
-
37
-
38
-
39
-
40
-
41
-
42
-
43
-
44
-
45
-
46
-
47
-
48
-
49
-
50
-
51
-
52
-
53
-
54
-
55
-
56
-
57
-
58
-
59
-
60
-
61
-
62
-
63
-
64
-
65
-
66
-
67
-
68
-
69
-
70
-
71
-
72
-
73
-
74
-
75
-
76
-
77
-
78
-
79
-
80
-
81
-
82
-
83
-
84
-
85
-
86
-
87
-
88
-
89
-
90
-
91
-
92
-
93
-
94
-
95
-
96
-
97
-
98
-
99
-
100
-
101
-
102
-
103
-
104
-
105
-
106
-
107
-
108
-
109
-
110
-
111
-
112
-
113
-
114
-
115
-
116
-
117
-
118
-
119
-
120
-
121
-
122
-
123
-
124
-
125
-
126
-
127
-
128
-
129
-
130
-
131
-
132
-
133
-
134
-
135
-
136
-
137
-
138
-
139
-
140
-
141
-
142
-
143
-
144
-
145
-
146
-
147
-
148
-
149
-
 150
150 -
 151
151 -
 152
152 -
 153
153 -
 154
154 -
 155
155 -
 156
156 -
 157
157 -
 158
158 -
 159
159 -
 160
160 -
 161
161 -
 162
162 -
 163
163 -
 164
164 -
 165
165 -
 166
166 -
 167
167 -
 168
168 -
 169
169 -
 170
170 -
171
-
172
-
173
-
174
-
175
-
176
-
177
-
178
-
179
-
180
-
181
-
182
-
183
-
184
-
185
-
186
-
187
-
188
-
189
-
190
-
191
-
192
-
193
-
194
-
195
-
196
-
197
-
198
-
199
-
200
-
201
-
202
-
203
-
204
-
205
-
206
-
207
-
208
-
209
-
210
-
211
-
212
-
213
-
214
-
215
-
216
-
217
-
218
-
219
-
220
-
221
-
222
-
223
-
224
-
225
-
226
-
227
-
228
-
229
-
230
-
231
-
232
-
233
-
234
-
235
-
236
-
237
-
238
-
239
-
240
-
241
-
242
-
243
-
244
-
245
-
246
-
247
-
248
-
249
-
250
-
251
-
252
-
253
-
254
-
255
-
256
-
257
-
258
-
259
-
260
-
261
-
262
-
263
-
264
-
265
-
266
-
267
-
268
-
269
-
270
-
271
-
272
-
273
-
274
-
275
-
276
-
277
-
278
-
279
-
280
-
281
-
282
-
283
-
284
-
285
-
286
-
287
-
288
-
289
-
290
-
291
-
292
-
293
-
294
-
295
-
296
-
297
-
298
-
299
-
300
-
301
-
302
-
303
-
304
-
305
-
306
-
307
-
308
-
309
-
310
-
311
-
312
-
313
-
314
-
315
-
316
-
317
-
318
-
319
-
320
-
321
-
322
-
323
-
324
-
325
-
326
-
327
-
328
-
329
-
330
-
331
-
332
-
333
-
334
-
335
-
336
-
337
-
338
-
339
-
340
-
341
-
342
-
343
-
344
 |
 |

6 To our shareholders 21 Corporate Governance 49 Combined management’s discussion and analysis
50 Business and operating environment
78 Fiscal – Financial summary
81 Results of operations
98 Financial position
110 Net assets position
113 Overall assessment of the economic position
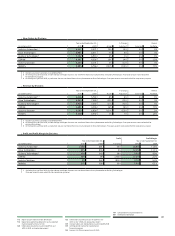
Siemens Financial Services (SFS)
(in millions of €)
Year ended September , % Change
Income before income taxes 447 304 47%
Total assets 12,506 11,704 7%
SFS raised its profit (defined as income before income taxes) in
fiscal to € million from € million a year earlier. The
increase in profit compared to fiscal came mainly from
higher results in the commercial finance business, driven by
significantly lower additions to loss reserves and higher inter-
est results. Fiscal profit benefited also from positive net
effects related to various investments, including a gain of €
million on the sale of an investment. These factors more than
offset lower income from SFS’s internal services business. To-
tal assets rose to €. billion, due primarily to currency
translation effects.
The following table provides further information on the capital
structure of SFS as of September , and :
(in millions of €)
September,
Allocated equity 1,458 1,243
Total debt 10,028 9,521
therein intragroup financing 10,004 9,455
therein debt from external sources 24 66
Debt to equity ratio 6.88 7.66
Cash and cash equivalents 90 136
Both Moody ’s and Standard & Poor’s view SFS as a captive fi-
nance company. These rating agencies generally recognize and
accept higher levels of debt attributable to captive finance
subsidiaries in determining long-term and short-term credit
ratings.
The allocated equity for SFS is primarily determined and influ-
enced by the size and quality of its portfolio of commercial fi-
nance assets (primarily leases and loans) and equity invest-
ments. This allocation is designed to cover the risks of the
underlying business and is oriented toward common credit risk
management standards in banking. The actual risk profile of
the SFS portfolio is evaluated and controlled monthly and is
reflected in the quarterly (commercial finance) and annual
(equity investments) adjustments of allocated equity.
Reconciliation to Consolidated Financial Statements
Reconciliation to Consolidated Financial Statements includes
Centrally managed portfolio activities, SRE and various catego-
ries of items which are not allocated to the Sectors and Cross-
Sector Businesses because the Company ’s management has
determined that such items are not indicative of the Sectors’
and Cross-Sector Businesses’ respective performance. For fiscal
, Company ’s management approved special remuneration
presented in Corporate Items which will be allocated primarily
to the Sectors in fiscal .
Siemens completed the streamlining of Other Operations in
fiscal . Beginning with fiscal , Segment Information
includes a new line item for centrally managed activities in-
tended for divestment or closure, which at present primarily
include the electronics assembly systems business and activi-
ties remaining from the divestment of the former Com activi-
ties. Results for the new line item, Centrally managed portfolio
activities, are stated on a retrospective basis.
Centrally managed portfolio activities
For fiscal , the result of Centrally managed portfolio ac-
tivities was a loss of € million compared to a loss of €
million a year earlier. Within this improvement, the loss related
to Electronics Assembly Systems declined to € million in
fiscal , including € million provided for in connection
with an expected loss from the announced sale to ASM Pacific
Technology. For comparison, the prior-year period included a
higher loss related to Electronics Assembly Systems, primarily
including € million related to the business due to operating
losses and charges for impairments and staff reduction mea-
sures. In addition, fiscal included a loss related to the di-
vestment of an industrial manufacturing unit in Austria, as
well as higher net expenses related to divested businesses.
Due primarily to portfolio streamlining activities, revenue from
Centrally managed portfolio activities fell to € million from
€ million a year earlier, despite higher sales from the elec-
tronics assembly systems business.