Siemens 2012 Annual Report Download - page 163
Download and view the complete annual report
Please find page 163 of the 2012 Siemens annual report below. You can navigate through the pages in the report by either clicking on the pages listed below, or by using the keyword search tool below to find specific information within the annual report.-
 1
1 -
2
-
3
-
4
-
5
-
6
-
7
-
8
-
9
-
10
-
11
-
12
-
13
-
14
-
15
-
16
-
17
-
18
-
19
-
20
-
21
-
22
-
23
-
24
-
25
-
26
-
27
-
28
-
29
-
30
-
31
-
32
-
33
-
34
-
35
-
36
-
37
-
38
-
39
-
40
-
41
-
42
-
43
-
44
-
45
-
46
-
47
-
48
-
49
-
50
-
51
-
52
-
53
-
54
-
55
-
56
-
57
-
58
-
59
-
60
-
61
-
62
-
63
-
64
-
65
-
66
-
67
-
68
-
69
-
70
-
71
-
72
-
73
-
74
-
75
-
76
-
77
-
78
-
79
-
80
-
81
-
82
-
83
-
84
-
85
-
86
-
87
-
88
-
89
-
90
-
91
-
92
-
93
-
94
-
95
-
96
-
97
-
98
-
99
-
100
-
101
-
102
-
103
-
104
-
105
-
106
-
107
-
108
-
109
-
110
-
111
-
112
-
113
-
114
-
115
-
116
-
117
-
118
-
119
-
120
-
121
-
122
-
123
-
124
-
125
-
126
-
127
-
128
-
129
-
130
-
131
-
132
-
133
-
134
-
135
-
136
-
137
-
138
-
139
-
140
-
141
-
142
-
143
-
144
-
145
-
146
-
147
-
148
-
149
-
150
-
151
-
152
-
 153
153 -
 154
154 -
 155
155 -
 156
156 -
 157
157 -
 158
158 -
 159
159 -
 160
160 -
 161
161 -
 162
162 -
 163
163 -
 164
164 -
 165
165 -
 166
166 -
 167
167 -
 168
168 -
 169
169 -
 170
170 -
 171
171 -
 172
172 -
 173
173 -
174
-
175
-
176
-
177
-
178
-
179
-
180
-
181
-
182
-
183
-
184
-
185
-
186
-
187
-
188
-
189
-
190
-
191
-
192
-
193
-
194
-
195
-
196
-
197
-
198
-
199
-
200
-
201
-
202
-
203
-
204
-
205
-
206
-
207
-
208
-
209
-
210
-
211
-
212
-
213
-
214
-
215
-
216
-
217
-
218
-
219
-
220
-
221
-
222
-
223
-
224
-
225
-
226
-
227
-
228
-
229
-
230
-
231
-
232
-
233
-
234
-
235
-
236
-
237
-
238
-
239
-
240
-
241
-
242
-
243
-
244
-
245
-
246
-
247
-
248
-
249
-
250
-
251
-
252
-
253
-
254
-
255
-
256
-
257
-
258
-
259
-
260
-
261
-
262
-
263
-
264
-
265
-
266
-
267
-
268
-
269
-
270
-
271
-
272
-
273
-
274
-
275
-
276
-
277
-
278
-
279
-
280
-
281
-
282
-
283
-
284
-
285
-
286
-
287
-
288
-
289
-
290
-
291
-
292
-
293
-
294
-
295
-
296
-
297
-
298
-
299
-
300
-
301
-
302
-
303
-
304
-
305
-
306
-
307
-
308
-
309
-
310
-
311
-
312
-
313
-
314
-
315
-
316
-
317
-
318
-
319
-
320
-
321
-
322
-
323
-
324
-
325
-
326
-
327
-
328
-
329
-
330
-
331
-
332
-
333
-
334
-
335
-
336
-
337
-
338
-
339
-
340
-
341
-
342
-
343
-
344
 |
 |
135 D. Consolidated Financial Statements
239 E. Additional Information
130 C. Siemens AG (Discussion on basis of
German Commercial Code)
134 C. Notes and forward-looking statements
129 C. Compensation Report, Corporate Governance
statement pursuant to Section a of the
German Commercial Code, Takeover-relevant
information and explanatory report
Energy reported a profit of €. billion in fiscal , a sharp
decrease compared to fiscal . Sector profit was held back
by project charges related to offshore grid connection projects
totaling € million. In the fourth quarter of fiscal ,
Siemens revised its credit risk assessment for Iran. In accor-
dance with project accounting principles, we therefore revised
project calculations for the affected contracts. The change in
credit risk assessment resulted in earnings impacts totaling
€ million mainly at Oil & Gas. Energy also recorded burdens
of € million associated with the Olkiluoto project in Fin-
land. In addition, Energy ’s business expansion strategy result-
ed in higher marketing, selling and general administrative ex-
penses as well as higher research and development expenses,
and profit development was also held back by a less favorable
revenue mix. For comparison, profit of €. billion in fiscal
benefited from the Areva NP gain of €. billion men-
tioned earlier, only partly offset by the € million profit im-
pact related to the arbitration decision discussed earlier and
the Sector’s € million share of special employee remunera-
tion costs. The Sector expects further profit impacts related to
Iran in fiscal .
Revenue rose on conversion from the Sector’s strong order
backlog in all three reporting regions, including a substantial
increase in Asia, Australia. Orders came in % lower compared
to the prior year, when the Sector recorded a substantially larg-
er volume from major orders. This comparison effect was par-
ticularly notable in Europe, C.I.S., Africa, Middle East. Energy ’s
book-to-bill ratio for fiscal was . and its order backlog
was € billion at the end of the period.
Fossil Power Generation generated profit of €. billion
on strong profit contributions from the service and products
businesses, while results from the solutions business were
significantly lower due to a less favorable project mix com-
pared to a year earlier. Profit benefited from a € million gain
from the sale of the % interest in OAO Power Machines. In
addition, the Division recorded higher expenses for market-
ing and selling year-over-year. For comparison, profit a year
earlier included the €. billion Areva NP gain and a more
favorable project mix in the component business, partly off-
set by the € million Areva arbitration impact. Profit in both
years was burdened by charges related to the Olkiluoto proj-
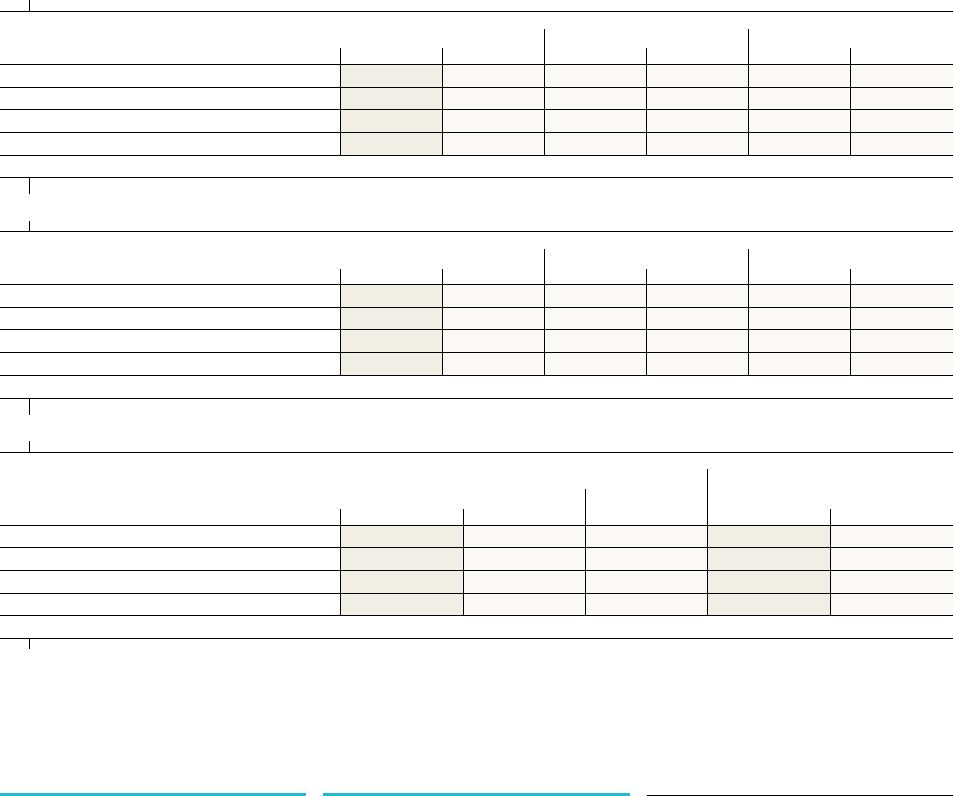
Year ended September , % Change therein
(in millions of €) Actual Adjusted Currency Portfolio
Fossil Power Generation 11,116 12,487 (11)% (17)% 2% 4%
Wind Power 4,932 6,461 (24)% (26)% 2% 0%
Oil & Gas 5,307 5,551 (4)% (10)% 2% 3%
Power Transmission 5,824 7,271 (20)% (21)% 1% 0%
1 Excluding currency translation and portfolio effects.
Profit Profit margin
Year ended September , Year ended September ,
(in millions of €) % Change
Fossil Power Generation 1,933 2,837 (32)% 17.3% 27.8%
Wind Power 304 357 (15)% 6.0% 9.7%
Oil & Gas 218 467 (53)% 4.3% 9.9%
Power Transmission (302) 566 n/a (4.6)% 8.9%
Year ended September , % Change therein
(in millions of €) Actual Adjusted Currency Portfolio
Fossil Power Generation 11,161 10,203 9% 5% 3% 2%
Wind Power 5,066 3,686 37% 29% 8% 0%
Oil & Gas 5,115 4,719 8% 3% 2% 3%
Power Transmission 6,593 6,334 4% 2% 2% 0%
1 Excluding currency translation and portfolio effects.