Siemens 2012 Annual Report Download - page 185
Download and view the complete annual report
Please find page 185 of the 2012 Siemens annual report below. You can navigate through the pages in the report by either clicking on the pages listed below, or by using the keyword search tool below to find specific information within the annual report.-
 1
1 -
2
-
3
-
4
-
5
-
6
-
7
-
8
-
9
-
10
-
11
-
12
-
13
-
14
-
15
-
16
-
17
-
18
-
19
-
20
-
21
-
22
-
23
-
24
-
25
-
26
-
27
-
28
-
29
-
30
-
31
-
32
-
33
-
34
-
35
-
36
-
37
-
38
-
39
-
40
-
41
-
42
-
43
-
44
-
45
-
46
-
47
-
48
-
49
-
50
-
51
-
52
-
53
-
54
-
55
-
56
-
57
-
58
-
59
-
60
-
61
-
62
-
63
-
64
-
65
-
66
-
67
-
68
-
69
-
70
-
71
-
72
-
73
-
74
-
75
-
76
-
77
-
78
-
79
-
80
-
81
-
82
-
83
-
84
-
85
-
86
-
87
-
88
-
89
-
90
-
91
-
92
-
93
-
94
-
95
-
96
-
97
-
98
-
99
-
100
-
101
-
102
-
103
-
104
-
105
-
106
-
107
-
108
-
109
-
110
-
111
-
112
-
113
-
114
-
115
-
116
-
117
-
118
-
119
-
120
-
121
-
122
-
123
-
124
-
125
-
126
-
127
-
128
-
129
-
130
-
131
-
132
-
133
-
134
-
135
-
136
-
137
-
138
-
139
-
140
-
141
-
142
-
143
-
144
-
145
-
146
-
147
-
148
-
149
-
150
-
151
-
152
-
153
-
154
-
155
-
156
-
157
-
158
-
159
-
160
-
161
-
162
-
163
-
164
-
165
-
166
-
167
-
168
-
169
-
170
-
171
-
172
-
173
-
174
-
 175
175 -
 176
176 -
 177
177 -
 178
178 -
 179
179 -
 180
180 -
 181
181 -
 182
182 -
 183
183 -
 184
184 -
 185
185 -
 186
186 -
 187
187 -
 188
188 -
 189
189 -
 190
190 -
 191
191 -
 192
192 -
 193
193 -
 194
194 -
 195
195 -
196
-
197
-
198
-
199
-
200
-
201
-
202
-
203
-
204
-
205
-
206
-
207
-
208
-
209
-
210
-
211
-
212
-
213
-
214
-
215
-
216
-
217
-
218
-
219
-
220
-
221
-
222
-
223
-
224
-
225
-
226
-
227
-
228
-
229
-
230
-
231
-
232
-
233
-
234
-
235
-
236
-
237
-
238
-
239
-
240
-
241
-
242
-
243
-
244
-
245
-
246
-
247
-
248
-
249
-
250
-
251
-
252
-
253
-
254
-
255
-
256
-
257
-
258
-
259
-
260
-
261
-
262
-
263
-
264
-
265
-
266
-
267
-
268
-
269
-
270
-
271
-
272
-
273
-
274
-
275
-
276
-
277
-
278
-
279
-
280
-
281
-
282
-
283
-
284
-
285
-
286
-
287
-
288
-
289
-
290
-
291
-
292
-
293
-
294
-
295
-
296
-
297
-
298
-
299
-
300
-
301
-
302
-
303
-
304
-
305
-
306
-
307
-
308
-
309
-
310
-
311
-
312
-
313
-
314
-
315
-
316
-
317
-
318
-
319
-
320
-
321
-
322
-
323
-
324
-
325
-
326
-
327
-
328
-
329
-
330
-
331
-
332
-
333
-
334
-
335
-
336
-
337
-
338
-
339
-
340
-
341
-
342
-
343
-
344
 |
 |

135 D. Consolidated Financial Statements
239 E. Additional Information
130 C. Siemens AG (Discussion on basis of
German Commercial Code)
134 C. Notes and forward-looking statements
129 C. Compensation Report, Corporate Governance
statement pursuant to Section a of the
German Commercial Code, Takeover-relevant
information and explanatory report
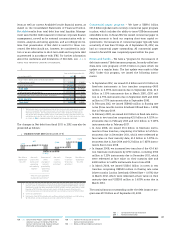
Shareholders’ equity and total assets were as follows:
(in millions of €)
Year ended September ,
Total equity attributable
to shareholders of Siemens AG 30,733 31,530
Equity ratio 28% 30%
Non-controlling interests 569 626
Total assets 108,282 104,243
Total equity attributable to shareholders of Siemens AG de-
creased from €. billion at the end of fiscal to €.
billion at the end of fiscal . In fiscal , the main factors
relating to the change in total equity attributable to sharehold-
ers of Siemens AG were: () Dividend payments of €. billion
(paid for fiscal ); () cancellation of ,, treasury
shares, which reduced common stock from million shares to
million shares; () repurchase of ,, treasury shares
at a weighted average share price of €.; () net income at-
tributable to shareholders of Siemens AG of €. billion.
The line item Total equity attributable to shareholders of
Siemens AG decreased by € million and total assets in-
creased by €. billion year-over-year, and as a result our eq-
uity ratio decreased to % as of September , compared
to % in the prior-year.
For additional information on our net assets position, see .
.
European sovereign credit exposures – Due to the recent
uncertainties with regard to European sovereign debt expo-
sures we regularly monitor our credit exposures in particular to
public and private sector debtors in Italy, Spain, Greece, Portugal
and Ireland. These credit exposures include trade receivables
from the sale of goods and services, receivables from finance
leases and other financial assets. To evaluate these exposures
we perform a credit rating for public and private sector debtors
using different methods subject to centrally defined limits. For
exposures to public sector debtors, which represented approxi-
mately a quarter of these exposures, we applied a specific poli-
cy: This policy provides that the rating applied to individual
public sector customers cannot be better than the weakest of
the sovereign ratings provided by Moody ’s, S&P’s and Fitch for
the respective country. Based on our ratings and our credit ex-
posures to end customers or main contractors located in Italy,
Spain, Greece, Portugal and Ireland, totaling a low single-digit
billion € amount as of September , , we believe that
Siemens is well-positioned to bear these risks.
In fiscal we increased revenue by % year-over-year to
€. billion, with all four Sectors and all three reporting re-
gions contributing to growth. New orders came in near the
level of revenue but % lower compared to the prior year,
which included substantially higher volumes from large orders
in our Sectors Infrastructure & Cities and Energy. For example,
orders a year earlier included Siemens’ largest-ever order for
trains, worth €. billion.
In fiscal , we achieved income from continuing operations
of €. billion. While this was one of our highest results ev-
er, it was substantially lower than in the prior year and lower
than we expected one year ago. The decline was due mainly to
our Energy Sector which took substantial charges mainly relat-
ed to projects with a complex marine and regulatory environ-
ment in the current period and benefited from the divestment
of its share in Areva NP in the prior year. Due mainly to chal-
lenges in these projects we reduced our income guidance dur-
ing fiscal . Furthermore, profit in Energy in fiscal was
also burdened by profit impacts of € million (pretax) related
to a change in credit risk assessment for Iran. Income from
continuing operations in fiscal was also held back by a
less favorable market environment in the second half of the
fiscal year. This was particularly evident in the Industry Sector
where profit came in % lower year-over-year. Profit at Infra-
structure & Cities in fiscal also declined year-over-year, as
the Sector took € million (pretax) in charges at a rolling
stock project in Germany. In contrast, our Healthcare Sector in-
creased profit year-over-year. For comparison, profit at Health-
care in fiscal was burdened by charges related to particle
therapy projects. In fiscal , income from continuing opera-
tions was also burdened by a sharply higher loss at Equity
Investments. This was due primarily to our share in NSN. In fis-
cal , NSN took substantial restructuring charges in con-
nection with its previously announced measures aimed at
maintaining its long-term competitiveness and improving
profitability.
Net income in fiscal was €. billion, down from €.
billion a year earlier. This decline was due to lower income
from continuing operations, only partly offset by lower losses
from discontinued operations. In the prior year, discontinued
operations were burdened by a substantial loss related to our
former Siemens IT Solutions and Services business, partly off-
set by income from discontinued operations related to OSRAM.
Income from discontinued operations related to OSRAM turned
negative in the current period.
As a result of the above-mentioned profit impacts, two of our
Sectors, Energy and Infrastructure & Cities, missed their re-
spective adjusted EBITDA target ranges in fiscal .
.