Siemens 2012 Annual Report Download - page 50
Download and view the complete annual report
Please find page 50 of the 2012 Siemens annual report below. You can navigate through the pages in the report by either clicking on the pages listed below, or by using the keyword search tool below to find specific information within the annual report.-
 1
1 -
2
-
3
-
4
-
5
-
6
-
7
-
8
-
9
-
10
-
11
-
12
-
13
-
14
-
15
-
16
-
17
-
18
-
19
-
20
-
21
-
22
-
23
-
24
-
25
-
26
-
27
-
28
-
29
-
30
-
31
-
32
-
33
-
34
-
35
-
36
-
37
-
38
-
39
-
 40
40 -
 41
41 -
 42
42 -
 43
43 -
 44
44 -
 45
45 -
 46
46 -
 47
47 -
 48
48 -
 49
49 -
 50
50 -
 51
51 -
 52
52 -
 53
53 -
 54
54 -
 55
55 -
 56
56 -
 57
57 -
 58
58 -
 59
59 -
 60
60 -
61
-
62
-
63
-
64
-
65
-
66
-
67
-
68
-
69
-
70
-
71
-
72
-
73
-
74
-
75
-
76
-
77
-
78
-
79
-
80
-
81
-
82
-
83
-
84
-
85
-
86
-
87
-
88
-
89
-
90
-
91
-
92
-
93
-
94
-
95
-
96
-
97
-
98
-
99
-
100
-
101
-
102
-
103
-
104
-
105
-
106
-
107
-
108
-
109
-
110
-
111
-
112
-
113
-
114
-
115
-
116
-
117
-
118
-
119
-
120
-
121
-
122
-
123
-
124
-
125
-
126
-
127
-
128
-
129
-
130
-
131
-
132
-
133
-
134
-
135
-
136
-
137
-
138
-
139
-
140
-
141
-
142
-
143
-
144
-
145
-
146
-
147
-
148
-
149
-
150
-
151
-
152
-
153
-
154
-
155
-
156
-
157
-
158
-
159
-
160
-
161
-
162
-
163
-
164
-
165
-
166
-
167
-
168
-
169
-
170
-
171
-
172
-
173
-
174
-
175
-
176
-
177
-
178
-
179
-
180
-
181
-
182
-
183
-
184
-
185
-
186
-
187
-
188
-
189
-
190
-
191
-
192
-
193
-
194
-
195
-
196
-
197
-
198
-
199
-
200
-
201
-
202
-
203
-
204
-
205
-
206
-
207
-
208
-
209
-
210
-
211
-
212
-
213
-
214
-
215
-
216
-
217
-
218
-
219
-
220
-
221
-
222
-
223
-
224
-
225
-
226
-
227
-
228
-
229
-
230
-
231
-
232
-
233
-
234
-
235
-
236
-
237
-
238
-
239
-
240
-
241
-
242
-
243
-
244
-
245
-
246
-
247
-
248
-
249
-
250
-
251
-
252
-
253
-
254
-
255
-
256
-
257
-
258
-
259
-
260
-
261
-
262
-
263
-
264
-
265
-
266
-
267
-
268
-
269
-
270
-
271
-
272
-
273
-
274
-
275
-
276
-
277
-
278
-
279
-
280
-
281
-
282
-
283
-
284
-
285
-
286
-
287
-
288
-
289
-
290
-
291
-
292
-
293
-
294
-
295
-
296
-
297
-
298
-
299
-
300
-
301
-
302
-
303
-
304
-
305
-
306
-
307
-
308
-
309
-
310
-
311
-
312
-
313
-
314
-
315
-
316
-
317
-
318
-
319
-
320
-
321
-
322
-
323
-
324
-
325
-
326
-
327
-
328
-
329
-
330
-
331
-
332
-
333
-
334
-
335
-
336
-
337
-
338
-
339
-
340
-
341
-
342
-
343
-
344
 |
 |

48
We’re convinced that the transition to a new energy system will succeed. It will unleash
a wave of innovation and create an exemplary energy infrastructure. Our technologies
are making it possible to increase the share of renewables in the energy mix and slash
greenhouse gas emissions. To make the transition a success, a variety of measures will
have to be implemented – measures that fit together like the pieces of a puzzle. Here are
some examples of how our technologies are already shaping the future of energy.
../--
–
,
Our self-learning software system is stabilizing the
power grid operated by Swissgrid in Laufenburg,
Switzerland. The program can forecast the electrical
output of renewable energy sources over a -hour
period with more than % accuracy. This information
helps grid operators calculate power demand in their
networks and achieve the greatest possible precision
when determining the amount of additional electricity
to be ordered in advance.
Ensuring a reliable
power supply
/
hours / days
,
We’ve partnered with Stadtwerke München, Munich’s
municipal utility, to develop and implement a so-called
virtual power plant in which a number of small-scale,
decentralized power generation installations are net-
worked and operated as a single system. In the first stage,
cogeneration plants with a total output of eight mega-
watts were virtually combined with renewable-energy
generating units with a capacity of megawatts.
The main aim of the virtual power plant is to improve the
reliability of planning and forecasting for the decentralized
power generation systems in the area served by Stadt-
werke München. Operation is more efficient and economi-
cal than when the individual units are deployed separately.
What’s more, the virtual power plant can serve as a key
element of a smart grid, maximizing the benefits for both
the operators of the decentralized energy installations and
the power suppliers. The core component of this virtual
interconnection is our Decentralized Energy Management
System (DEMS), which is enabling the Munich utility not
only to optimize the deployment and operation of decen-
tralized power generation facilities and power loads but
also to create value through enhanced marketing scope.
Grid forecast software
~% predictive accuracy over a -hour period
~ € , in annual savings
Better forecasts for
electricity production
Smart grids: Making power
grids more intelligent
Virtual power plant
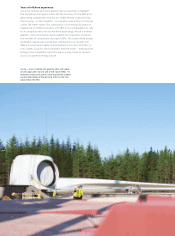
hydropower plants
wind turbine assembly
Can be virtually expanded at any time
Current capacity MW
cogeneration modules