Siemens 2012 Annual Report Download - page 273
Download and view the complete annual report
Please find page 273 of the 2012 Siemens annual report below. You can navigate through the pages in the report by either clicking on the pages listed below, or by using the keyword search tool below to find specific information within the annual report.-
 1
1 -
2
-
3
-
4
-
5
-
6
-
7
-
8
-
9
-
10
-
11
-
12
-
13
-
14
-
15
-
16
-
17
-
18
-
19
-
20
-
21
-
22
-
23
-
24
-
25
-
26
-
27
-
28
-
29
-
30
-
31
-
32
-
33
-
34
-
35
-
36
-
37
-
38
-
39
-
40
-
41
-
42
-
43
-
44
-
45
-
46
-
47
-
48
-
49
-
50
-
51
-
52
-
53
-
54
-
55
-
56
-
57
-
58
-
59
-
60
-
61
-
62
-
63
-
64
-
65
-
66
-
67
-
68
-
69
-
70
-
71
-
72
-
73
-
74
-
75
-
76
-
77
-
78
-
79
-
80
-
81
-
82
-
83
-
84
-
85
-
86
-
87
-
88
-
89
-
90
-
91
-
92
-
93
-
94
-
95
-
96
-
97
-
98
-
99
-
100
-
101
-
102
-
103
-
104
-
105
-
106
-
107
-
108
-
109
-
110
-
111
-
112
-
113
-
114
-
115
-
116
-
117
-
118
-
119
-
120
-
121
-
122
-
123
-
124
-
125
-
126
-
127
-
128
-
129
-
130
-
131
-
132
-
133
-
134
-
135
-
136
-
137
-
138
-
139
-
140
-
141
-
142
-
143
-
144
-
145
-
146
-
147
-
148
-
149
-
150
-
151
-
152
-
153
-
154
-
155
-
156
-
157
-
158
-
159
-
160
-
161
-
162
-
163
-
164
-
165
-
166
-
167
-
168
-
169
-
170
-
171
-
172
-
173
-
174
-
175
-
176
-
177
-
178
-
179
-
180
-
181
-
182
-
183
-
184
-
185
-
186
-
187
-
188
-
189
-
190
-
191
-
192
-
193
-
194
-
195
-
196
-
197
-
198
-
199
-
200
-
201
-
202
-
203
-
204
-
205
-
206
-
207
-
208
-
209
-
210
-
211
-
212
-
213
-
214
-
215
-
216
-
217
-
218
-
219
-
220
-
221
-
222
-
223
-
224
-
225
-
226
-
227
-
228
-
229
-
230
-
231
-
232
-
233
-
234
-
235
-
236
-
237
-
238
-
239
-
240
-
241
-
242
-
243
-
244
-
245
-
246
-
247
-
248
-
249
-
250
-
251
-
252
-
253
-
254
-
255
-
256
-
257
-
258
-
259
-
260
-
261
-
262
-
 263
263 -
 264
264 -
 265
265 -
 266
266 -
 267
267 -
 268
268 -
 269
269 -
 270
270 -
 271
271 -
 272
272 -
 273
273 -
 274
274 -
 275
275 -
 276
276 -
 277
277 -
 278
278 -
 279
279 -
 280
280 -
 281
281 -
 282
282 -
 283
283 -
284
-
285
-
286
-
287
-
288
-
289
-
290
-
291
-
292
-
293
-
294
-
295
-
296
-
297
-
298
-
299
-
300
-
301
-
302
-
303
-
304
-
305
-
306
-
307
-
308
-
309
-
310
-
311
-
312
-
313
-
314
-
315
-
316
-
317
-
318
-
319
-
320
-
321
-
322
-
323
-
324
-
325
-
326
-
327
-
328
-
329
-
330
-
331
-
332
-
333
-
334
-
335
-
336
-
337
-
338
-
339
-
340
-
341
-
342
-
343
-
344
 |
 |

135 D. Consolidated Financial Statements 239 E. Additional Information
140 D. Consolidated Statements of Changes in Equity
142 D. Notes to Consolidated Financial Statements
232 D. Supervisory Board and Managing Board
136 D. Consolidated Statements of Income
137 D. Consolidated Statements of Comprehensive Income
138 D. Consolidated Statements of Financial Position
139 D. Consolidated Statements of Cash Flow
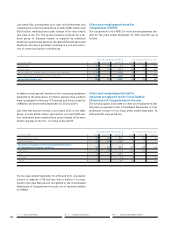
Other post-employment benefits:
assumptions used in the calculation
of the DBO and NPBC
Discount rates and other key assumptions used for transition
payments in Germany are the same as those utilized for domes-
tic pension benefit plans.
The weighted-average assumptions used in calculating the
actuarial values for the post-employment healthcare and life
insurance benefits are as follows:
Year ended September ,
Discount rate 3.1% 4.57%
U.S.:
Medical trend rates
(initial/ultimate/year):
Medicare ineligible pre- 9%/5%/2021 9%/5%/2020
Medicare eligible post- 8%/5%/2018 8.5%/5%/2019
Dental trend rates
(initial/ultimate/year) 6%/5%/2021 6%/5%/2021
Canada:
Medical trend rates
(initial/ultimate/year) 8.4%/5%/2019 9%/5%/2019
Drug trend rates
(initial/ultimate/year) 8.4%/5%/2019 9%/5%/2019
Dental trend rates 4% 4%
Experience adjustments, which result from differences be-
tween the actuarial assumptions and the actual occurrence,
increased the DBO by .% in fiscal , decreased the DBO by
.% in fiscal , increased the DBO by .% in fiscal
and decreased the DBO by .% and .% in fiscal and
, respectively.
Other post-employment benefits:
sensitivity analysis
The health care assumptions may be significantly influenced
by the expected progression in health care expense. A one-per-
centage-point change in the healthcare trend rates would have
resulted in the following increase (decrease) of the defined
benefit obligation and the service and interest cost as of and
for the year ended September , :
September ,
One-percentage-point
(in millions of €) increase decrease
Effect on defined benefit obligation 28 (23)
Effect on total of service and
interest cost components 2 (2)
Other post-employment benefits:
benefit payments
The following overview comprises benefit payments for other
post-employment benefits paid out of the other defined bene-
fit post-employment plans during the years ended September
, and , and expected pension payments for the
next five years and in the aggregate for the five years thereaf-
ter (undiscounted):
(in millions of €) Total Domestic Foreign
Payments for other
post-employment benefits
2011 56 28 28
2012 47 25 22
Expected payments for other
post-employment benefits
2013 67 39 28
2014 51 29 22
2015 57 35 22
2016 57 34 23
2017 61 39 22
2018 – 2022 282 176 106
Payments for other post-employment benefits made by OSRAM
for the year ended September , , which are not included
in the table above, amounted to € million. Amounts present-
ed for the year ended September , in the table above in-
clude amounts related to Siemens IT Solutions and Services
and OSRAM.
Since the benefit obligations for other post-employment bene-
fits are generally not funded, such payments will impact the
current operating cash flow of the Company.
The amount recognized as an expense for defined contribution
plans amounted to € million in fiscal and € million
in fiscal , respectively. Contributions to state plans
amounted to €, million in fiscal and €, million in
fiscal , respectively.