Siemens 2012 Annual Report Download - page 88
Download and view the complete annual report
Please find page 88 of the 2012 Siemens annual report below. You can navigate through the pages in the report by either clicking on the pages listed below, or by using the keyword search tool below to find specific information within the annual report.-
 1
1 -
2
-
3
-
4
-
5
-
6
-
7
-
8
-
9
-
10
-
11
-
12
-
13
-
14
-
15
-
16
-
17
-
18
-
19
-
20
-
21
-
22
-
23
-
24
-
25
-
26
-
27
-
28
-
29
-
30
-
31
-
32
-
33
-
34
-
35
-
36
-
37
-
38
-
39
-
40
-
41
-
42
-
43
-
44
-
45
-
46
-
47
-
48
-
49
-
50
-
51
-
52
-
53
-
54
-
55
-
56
-
57
-
58
-
59
-
60
-
61
-
62
-
63
-
64
-
65
-
66
-
67
-
68
-
69
-
70
-
71
-
72
-
73
-
74
-
75
-
76
-
77
-
 78
78 -
 79
79 -
 80
80 -
 81
81 -
 82
82 -
 83
83 -
 84
84 -
 85
85 -
 86
86 -
 87
87 -
 88
88 -
 89
89 -
 90
90 -
 91
91 -
 92
92 -
 93
93 -
 94
94 -
 95
95 -
 96
96 -
 97
97 -
 98
98 -
99
-
100
-
101
-
102
-
103
-
104
-
105
-
106
-
107
-
108
-
109
-
110
-
111
-
112
-
113
-
114
-
115
-
116
-
117
-
118
-
119
-
120
-
121
-
122
-
123
-
124
-
125
-
126
-
127
-
128
-
129
-
130
-
131
-
132
-
133
-
134
-
135
-
136
-
137
-
138
-
139
-
140
-
141
-
142
-
143
-
144
-
145
-
146
-
147
-
148
-
149
-
150
-
151
-
152
-
153
-
154
-
155
-
156
-
157
-
158
-
159
-
160
-
161
-
162
-
163
-
164
-
165
-
166
-
167
-
168
-
169
-
170
-
171
-
172
-
173
-
174
-
175
-
176
-
177
-
178
-
179
-
180
-
181
-
182
-
183
-
184
-
185
-
186
-
187
-
188
-
189
-
190
-
191
-
192
-
193
-
194
-
195
-
196
-
197
-
198
-
199
-
200
-
201
-
202
-
203
-
204
-
205
-
206
-
207
-
208
-
209
-
210
-
211
-
212
-
213
-
214
-
215
-
216
-
217
-
218
-
219
-
220
-
221
-
222
-
223
-
224
-
225
-
226
-
227
-
228
-
229
-
230
-
231
-
232
-
233
-
234
-
235
-
236
-
237
-
238
-
239
-
240
-
241
-
242
-
243
-
244
-
245
-
246
-
247
-
248
-
249
-
250
-
251
-
252
-
253
-
254
-
255
-
256
-
257
-
258
-
259
-
260
-
261
-
262
-
263
-
264
-
265
-
266
-
267
-
268
-
269
-
270
-
271
-
272
-
273
-
274
-
275
-
276
-
277
-
278
-
279
-
280
-
281
-
282
-
283
-
284
-
285
-
286
-
287
-
288
-
289
-
290
-
291
-
292
-
293
-
294
-
295
-
296
-
297
-
298
-
299
-
300
-
301
-
302
-
303
-
304
-
305
-
306
-
307
-
308
-
309
-
310
-
311
-
312
-
313
-
314
-
315
-
316
-
317
-
318
-
319
-
320
-
321
-
322
-
323
-
324
-
325
-
326
-
327
-
328
-
329
-
330
-
331
-
332
-
333
-
334
-
335
-
336
-
337
-
338
-
339
-
340
-
341
-
342
-
343
-
344
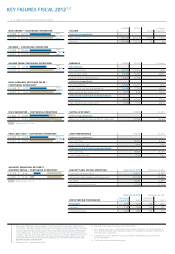
 |
 |

,
in millions of €, except where otherwise stated
( ) –
FY 5.77
FY 8.23
FY 5,184
FY 7,376
FY FY
Continuing operations
Return on capital employed (ROCE) (adjusted) 17.0% 25.3%
FY FY
Continuing operations
Free cash flow 4,790 5,918
Cash conversion rate 0.92 0.80
Continuing and discontinued operations
Free cash flow 4,562 5,150
Cash conversion rate 0.99 0.81
September , September ,
Cash and cash equivalents 10,891 12,468
Total equity (Shareholders of Siemens AG) 30,733 31,530
Net debt 9,292 4,995
Adjusted industrial net debt 2,396 (1,534)
( )
September , September ,
Continuing Continuing
operations Total operations Total
Employees 370 410 359 402
Germany 119 130 116 127
Outside Germany 250 280 243 275
FY FY % Change
Total Sectors
Adjusted EBITDA 9,471 10,404 (9)%
Total Sectors Profit 7,543 9,442 (20)%
in % of revenue (Total Sectors) 9.5% 12.8%
Continuing operations
Adjusted EBITDA 9,788 10,701 (9)%
Income from continuing operations 5,184 7,376 (30)%
Basic earnings per share (in €) 5.77 8.23 (30)%
Continuing and discontinued operations
Net income 4,590 6,321 (27)%
Basic earnings per share (in €) 5.09 7.04 (28)%
FY FY % Change
Actual Adjusted
Continuing operations
New orders 76,913 85,166 (10)% (13)%
Revenue 78,296 73,275 7% 3%
–
FY 4,790
FY 5,918 (19)%
–
FY 78,296
FY 73,275 3% 3
(30)%
(30)%
–
FY 76,913
FY 85,166 (13)% 3
/
–
FY 0.24
FY (0.14)
Target corridor: . – .
() –
FY 17.0%
FY 25.3%
Target corridor: – %
1 New orders; Adjusted or organic growth rates of revenue and new orders; Total Sectors
Profit; ROCE (adjusted); Free cash flow and cash conversion rate; Adjusted EBITDA; Net debt
and adjusted industrial net debt are or may be non-GAAP financial measures. Definitions of
these supplemental financial measures, a discussion of the most directly comparable IFRS
financial measures, infor mation regarding the usefulness of Siemens’ supplemental financial
measures, the limitations associated with these measures and recon ciliations to the most
comparable IFRS financial measures are available on our Investor Relations website under
../
2 October , – September , .
3 Adjusted for portfolio and currency translation effects.
4 Basic earnings per share – attributable to shareholders of Siemens AG. For fiscal and
weighted aver age shares outstanding (basic) (in thousands) amounted to , and
, shares, respectively.
5 Calculated by dividing adjusted industrial net debt as of September , and
by adjusted EBITDA.
6 Continuing and discontinued operations.