Siemens 2012 Annual Report Download - page 271
Download and view the complete annual report
Please find page 271 of the 2012 Siemens annual report below. You can navigate through the pages in the report by either clicking on the pages listed below, or by using the keyword search tool below to find specific information within the annual report.-
 1
1 -
2
-
3
-
4
-
5
-
6
-
7
-
8
-
9
-
10
-
11
-
12
-
13
-
14
-
15
-
16
-
17
-
18
-
19
-
20
-
21
-
22
-
23
-
24
-
25
-
26
-
27
-
28
-
29
-
30
-
31
-
32
-
33
-
34
-
35
-
36
-
37
-
38
-
39
-
40
-
41
-
42
-
43
-
44
-
45
-
46
-
47
-
48
-
49
-
50
-
51
-
52
-
53
-
54
-
55
-
56
-
57
-
58
-
59
-
60
-
61
-
62
-
63
-
64
-
65
-
66
-
67
-
68
-
69
-
70
-
71
-
72
-
73
-
74
-
75
-
76
-
77
-
78
-
79
-
80
-
81
-
82
-
83
-
84
-
85
-
86
-
87
-
88
-
89
-
90
-
91
-
92
-
93
-
94
-
95
-
96
-
97
-
98
-
99
-
100
-
101
-
102
-
103
-
104
-
105
-
106
-
107
-
108
-
109
-
110
-
111
-
112
-
113
-
114
-
115
-
116
-
117
-
118
-
119
-
120
-
121
-
122
-
123
-
124
-
125
-
126
-
127
-
128
-
129
-
130
-
131
-
132
-
133
-
134
-
135
-
136
-
137
-
138
-
139
-
140
-
141
-
142
-
143
-
144
-
145
-
146
-
147
-
148
-
149
-
150
-
151
-
152
-
153
-
154
-
155
-
156
-
157
-
158
-
159
-
160
-
161
-
162
-
163
-
164
-
165
-
166
-
167
-
168
-
169
-
170
-
171
-
172
-
173
-
174
-
175
-
176
-
177
-
178
-
179
-
180
-
181
-
182
-
183
-
184
-
185
-
186
-
187
-
188
-
189
-
190
-
191
-
192
-
193
-
194
-
195
-
196
-
197
-
198
-
199
-
200
-
201
-
202
-
203
-
204
-
205
-
206
-
207
-
208
-
209
-
210
-
211
-
212
-
213
-
214
-
215
-
216
-
217
-
218
-
219
-
220
-
221
-
222
-
223
-
224
-
225
-
226
-
227
-
228
-
229
-
230
-
231
-
232
-
233
-
234
-
235
-
236
-
237
-
238
-
239
-
240
-
241
-
242
-
243
-
244
-
245
-
246
-
247
-
248
-
249
-
250
-
251
-
252
-
253
-
254
-
255
-
256
-
257
-
258
-
259
-
260
-
 261
261 -
 262
262 -
 263
263 -
 264
264 -
 265
265 -
 266
266 -
 267
267 -
 268
268 -
 269
269 -
 270
270 -
 271
271 -
 272
272 -
 273
273 -
 274
274 -
 275
275 -
 276
276 -
 277
277 -
 278
278 -
 279
279 -
 280
280 -
 281
281 -
282
-
283
-
284
-
285
-
286
-
287
-
288
-
289
-
290
-
291
-
292
-
293
-
294
-
295
-
296
-
297
-
298
-
299
-
300
-
301
-
302
-
303
-
304
-
305
-
306
-
307
-
308
-
309
-
310
-
311
-
312
-
313
-
314
-
315
-
316
-
317
-
318
-
319
-
320
-
321
-
322
-
323
-
324
-
325
-
326
-
327
-
328
-
329
-
330
-
331
-
332
-
333
-
334
-
335
-
336
-
337
-
338
-
339
-
340
-
341
-
342
-
343
-
344
 |
 |

135 D. Consolidated Financial Statements 239 E. Additional Information
140 D. Consolidated Statements of Changes in Equity
142 D. Notes to Consolidated Financial Statements
232 D. Supervisory Board and Managing Board
136 D. Consolidated Statements of Income
137 D. Consolidated Statements of Comprehensive Income
138 D. Consolidated Statements of Financial Position
139 D. Consolidated Statements of Cash Flow
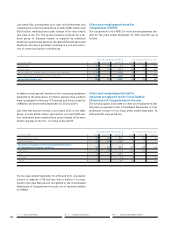
Other post-employment benefits:
obligations, plan assets and funded status
The funded status of plan assets and a reconciliation of the
funded status to the amounts recognized in the Consolidated
Statements of Financial Position are as follows:
The following table shows a detailed reconciliation of the
changes in the benefit obligation and in plan assets for other
post-employment benefits for the years ended September ,
and (DBO and fair value of plan assets at beginning
September , September ,
(in millions of €) Total Domestic Foreign Total Domestic Foreign
Fair value of plan assets 5 – 5 4 – 4
Total defined benefit obligation 685 340 345 764 307 457
Defined benefit obligation (funded) 180 – 180 286 – 286
Defined benefit obligation (unfunded) 505 340 165 478 307 171
Funded status (680) (340) (340) (760) (307) (453)
Unrecognized past service cost (benefits) (1) – (1) 6 – 6
Net amount recognized (681) (340) (341) (754) (307) (447)
September , September ,
(in millions of €) Total Domestic Foreign Total Domestic Foreign
Change in benefit obligations:
Defined benefit obligation at beginning of year 802 318 484 838 350 488
Foreign currency exchange rate changes 28 – 28 2 – 2
Service cost 18 9 9 22 10 12
Interest cost 38 14 24 38 14 24
Settlements and curtailments (30) – (30) (11) (2) (9)
Plan amendments and other (134) – (134) 2 – 2
Actuarial (gains) losses 94 37 57 (24) (18) (6)
Acquisitions – – – 3 3 –
Benefits paid (53) (27) (26) (56) (28) (28)
Divestments – – – (12) (11) (1)
Reclassification to assets and to liabilities associated
with assets classified as held for disposal for OSRAM (79) (12) (67) (38) (11) (27)
Defined benefit obligation at end of year 685 340 345 764 307 457
September , September ,
(in millions of €) Total Domestic Foreign Total Domestic Foreign
Change in plan assets:
Fair value of plan assets at beginning of year 4 – 4 4 – 4
Actual return on plan assets 1 – 1 – – –
Employer contributions 13 – 13 24 – 24
Benefits paid (13) – (13) (24) – (24)
Fair value of plan assets at end of year 5 – 5 4 – 4
of fiscal and reconciliation items for fiscal are pre-
sented inclusive of OSRAM in order to conform to the prior-
year presentation):