Siemens 2012 Annual Report Download - page 255
Download and view the complete annual report
Please find page 255 of the 2012 Siemens annual report below. You can navigate through the pages in the report by either clicking on the pages listed below, or by using the keyword search tool below to find specific information within the annual report.-
 1
1 -
2
-
3
-
4
-
5
-
6
-
7
-
8
-
9
-
10
-
11
-
12
-
13
-
14
-
15
-
16
-
17
-
18
-
19
-
20
-
21
-
22
-
23
-
24
-
25
-
26
-
27
-
28
-
29
-
30
-
31
-
32
-
33
-
34
-
35
-
36
-
37
-
38
-
39
-
40
-
41
-
42
-
43
-
44
-
45
-
46
-
47
-
48
-
49
-
50
-
51
-
52
-
53
-
54
-
55
-
56
-
57
-
58
-
59
-
60
-
61
-
62
-
63
-
64
-
65
-
66
-
67
-
68
-
69
-
70
-
71
-
72
-
73
-
74
-
75
-
76
-
77
-
78
-
79
-
80
-
81
-
82
-
83
-
84
-
85
-
86
-
87
-
88
-
89
-
90
-
91
-
92
-
93
-
94
-
95
-
96
-
97
-
98
-
99
-
100
-
101
-
102
-
103
-
104
-
105
-
106
-
107
-
108
-
109
-
110
-
111
-
112
-
113
-
114
-
115
-
116
-
117
-
118
-
119
-
120
-
121
-
122
-
123
-
124
-
125
-
126
-
127
-
128
-
129
-
130
-
131
-
132
-
133
-
134
-
135
-
136
-
137
-
138
-
139
-
140
-
141
-
142
-
143
-
144
-
145
-
146
-
147
-
148
-
149
-
150
-
151
-
152
-
153
-
154
-
155
-
156
-
157
-
158
-
159
-
160
-
161
-
162
-
163
-
164
-
165
-
166
-
167
-
168
-
169
-
170
-
171
-
172
-
173
-
174
-
175
-
176
-
177
-
178
-
179
-
180
-
181
-
182
-
183
-
184
-
185
-
186
-
187
-
188
-
189
-
190
-
191
-
192
-
193
-
194
-
195
-
196
-
197
-
198
-
199
-
200
-
201
-
202
-
203
-
204
-
205
-
206
-
207
-
208
-
209
-
210
-
211
-
212
-
213
-
214
-
215
-
216
-
217
-
218
-
219
-
220
-
221
-
222
-
223
-
224
-
225
-
226
-
227
-
228
-
229
-
230
-
231
-
232
-
233
-
234
-
235
-
236
-
237
-
238
-
239
-
240
-
241
-
242
-
243
-
244
-
 245
245 -
 246
246 -
 247
247 -
 248
248 -
 249
249 -
 250
250 -
 251
251 -
 252
252 -
 253
253 -
 254
254 -
 255
255 -
 256
256 -
 257
257 -
 258
258 -
 259
259 -
 260
260 -
 261
261 -
 262
262 -
 263
263 -
 264
264 -
 265
265 -
266
-
267
-
268
-
269
-
270
-
271
-
272
-
273
-
274
-
275
-
276
-
277
-
278
-
279
-
280
-
281
-
282
-
283
-
284
-
285
-
286
-
287
-
288
-
289
-
290
-
291
-
292
-
293
-
294
-
295
-
296
-
297
-
298
-
299
-
300
-
301
-
302
-
303
-
304
-
305
-
306
-
307
-
308
-
309
-
310
-
311
-
312
-
313
-
314
-
315
-
316
-
317
-
318
-
319
-
320
-
321
-
322
-
323
-
324
-
325
-
326
-
327
-
328
-
329
-
330
-
331
-
332
-
333
-
334
-
335
-
336
-
337
-
338
-
339
-
340
-
341
-
342
-
343
-
344
 |
 |
135 D. Consolidated Financial Statements 239 E. Additional Information
140 D. Consolidated Statements of Changes in Equity
142 D. Notes to Consolidated Financial Statements
232 D. Supervisory Board and Managing Board
136 D. Consolidated Statements of Income
137 D. Consolidated Statements of Comprehensive Income
138 D. Consolidated Statements of Financial Position
139 D. Consolidated Statements of Cash Flow
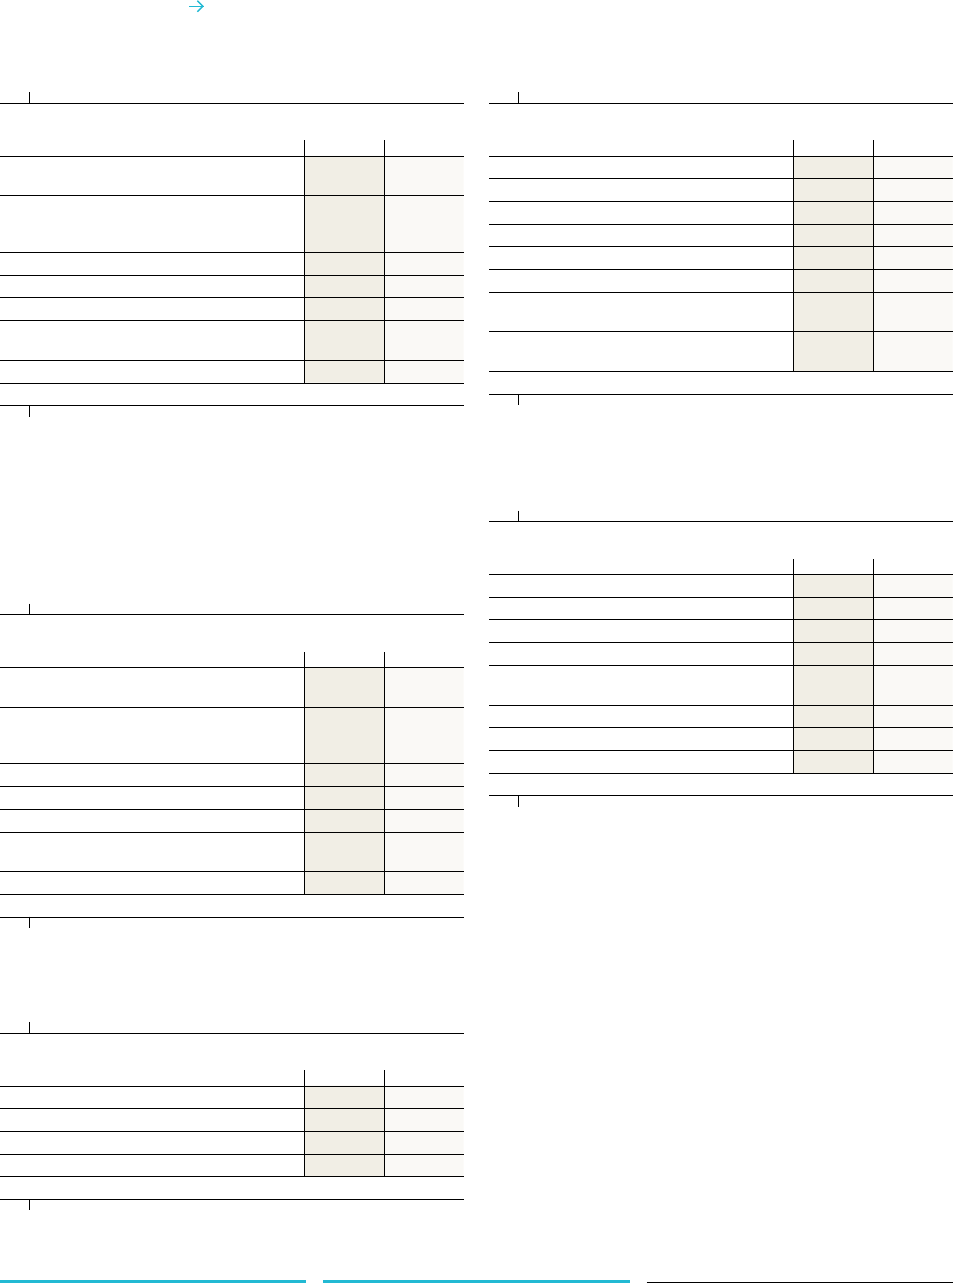
Changes to the valuation allowance of current and long-term
receivables presented in , , which belong to
the class of financial assets measured at (amortized) cost are
as follows (excluding receivables from finance leases):
Year ended September ,
(in millions of €)
Valuation allowance as of beginning
of fiscal year 1,005 993
Increase in valuation allowances recorded
in the Consolidated Statements of Income
in the current period 191 210
Write-offs charged against the allowance (108) (145)
Recoveries of amounts previously written-off 713
Foreign exchange translation differences 14 (10)
Reclassifications to line item Assets held for
disposal and dispositions of those entities (54) (56)
Valuation allowance as of fiscal year-end 1,056 1,005
In fiscal and , receivables from finance leases, current
amount to €, million and €, million, respectively; the
long-term portion amounts to €, million and €, mil-
lion, respectively. The valuation allowance on current and
long-term receivables from finance leases changed as follows:
Year ended September ,
(in millions of €)
Valuation allowance as of beginning
of fiscal year 142 168
Increase in valuation allowances recorded
in the Consolidated Statements of Income
in the current period 23 34
Write-offs charged against the allowance (40) (65)
Recoveries of amounts previously written-off 67
Foreign exchange translation differences 5(2)
Reclassifications to line item Assets held for
disposal and dispositions of those entities (2) –
Valuation allowance as of fiscal year-end 134 142
Minimum future lease payments to be received are as follows:
September ,
(in millions of €)
Within one year 2,360 2,139
After one year but not more than five years 3,151 3,047
More than five years 209 166
5,719 5,352
The following table shows a reconciliation of minimum future
lease payments to the gross and net investment in leases and
to the present value of the minimum future lease payments re-
ceivable:
September ,
(in millions of €)
Minimum future lease payments 5,719 5,352
Plus: Unguaranteed residual values 131 145
Gross investment in leases 5,850 5,497
Less: Unearned finance income (657) (613)
Net investment in leases 5,193 4,884
Less: Allowance for doubtful accounts (134) (142)
Less: Present value of unguaranteed
residual value (117) (125)
Present value of minimum
future lease payments receivable 4,942 4,617
The gross investment in leases and the present value of mini-
mum future lease payments receivable are due as follows:
September ,
(in millions of €)
Gross investment in leases 5,850 5,497
Within one year 2,388 2,167
One to five years 3,248 3,155
Thereafter 214 175
Present value of minimum
future lease payments receivable 4,942 4,617
Within one year 2,012 1,830
One to five years 2,743 2,639
Thereafter 187 148
Investments in finance leases primarily relate to equipment for
information technology and office machines, industrial ma-
chinery, medical equipment and transportation systems. Actual
cash flows will vary from contractual maturities due to future
sales of finance receivables, prepayments and write-offs.