Siemens 2012 Annual Report Download - page 279
Download and view the complete annual report
Please find page 279 of the 2012 Siemens annual report below. You can navigate through the pages in the report by either clicking on the pages listed below, or by using the keyword search tool below to find specific information within the annual report.-
 1
1 -
2
-
3
-
4
-
5
-
6
-
7
-
8
-
9
-
10
-
11
-
12
-
13
-
14
-
15
-
16
-
17
-
18
-
19
-
20
-
21
-
22
-
23
-
24
-
25
-
26
-
27
-
28
-
29
-
30
-
31
-
32
-
33
-
34
-
35
-
36
-
37
-
38
-
39
-
40
-
41
-
42
-
43
-
44
-
45
-
46
-
47
-
48
-
49
-
50
-
51
-
52
-
53
-
54
-
55
-
56
-
57
-
58
-
59
-
60
-
61
-
62
-
63
-
64
-
65
-
66
-
67
-
68
-
69
-
70
-
71
-
72
-
73
-
74
-
75
-
76
-
77
-
78
-
79
-
80
-
81
-
82
-
83
-
84
-
85
-
86
-
87
-
88
-
89
-
90
-
91
-
92
-
93
-
94
-
95
-
96
-
97
-
98
-
99
-
100
-
101
-
102
-
103
-
104
-
105
-
106
-
107
-
108
-
109
-
110
-
111
-
112
-
113
-
114
-
115
-
116
-
117
-
118
-
119
-
120
-
121
-
122
-
123
-
124
-
125
-
126
-
127
-
128
-
129
-
130
-
131
-
132
-
133
-
134
-
135
-
136
-
137
-
138
-
139
-
140
-
141
-
142
-
143
-
144
-
145
-
146
-
147
-
148
-
149
-
150
-
151
-
152
-
153
-
154
-
155
-
156
-
157
-
158
-
159
-
160
-
161
-
162
-
163
-
164
-
165
-
166
-
167
-
168
-
169
-
170
-
171
-
172
-
173
-
174
-
175
-
176
-
177
-
178
-
179
-
180
-
181
-
182
-
183
-
184
-
185
-
186
-
187
-
188
-
189
-
190
-
191
-
192
-
193
-
194
-
195
-
196
-
197
-
198
-
199
-
200
-
201
-
202
-
203
-
204
-
205
-
206
-
207
-
208
-
209
-
210
-
211
-
212
-
213
-
214
-
215
-
216
-
217
-
218
-
219
-
220
-
221
-
222
-
223
-
224
-
225
-
226
-
227
-
228
-
229
-
230
-
231
-
232
-
233
-
234
-
235
-
236
-
237
-
238
-
239
-
240
-
241
-
242
-
243
-
244
-
245
-
246
-
247
-
248
-
249
-
250
-
251
-
252
-
253
-
254
-
255
-
256
-
257
-
258
-
259
-
260
-
261
-
262
-
263
-
264
-
265
-
266
-
267
-
268
-
 269
269 -
 270
270 -
 271
271 -
 272
272 -
 273
273 -
 274
274 -
 275
275 -
 276
276 -
 277
277 -
 278
278 -
 279
279 -
 280
280 -
 281
281 -
 282
282 -
 283
283 -
 284
284 -
 285
285 -
 286
286 -
 287
287 -
 288
288 -
 289
289 -
290
-
291
-
292
-
293
-
294
-
295
-
296
-
297
-
298
-
299
-
300
-
301
-
302
-
303
-
304
-
305
-
306
-
307
-
308
-
309
-
310
-
311
-
312
-
313
-
314
-
315
-
316
-
317
-
318
-
319
-
320
-
321
-
322
-
323
-
324
-
325
-
326
-
327
-
328
-
329
-
330
-
331
-
332
-
333
-
334
-
335
-
336
-
337
-
338
-
339
-
340
-
341
-
342
-
343
-
344
 |
 |

135 D. Consolidated Financial Statements 239 E. Additional Information
140 D. Consolidated Statements of Changes in Equity
142 D. Notes to Consolidated Financial Statements
232 D. Supervisory Board and Managing Board
136 D. Consolidated Statements of Income
137 D. Consolidated Statements of Comprehensive Income
138 D. Consolidated Statements of Financial Position
139 D. Consolidated Statements of Cash Flow
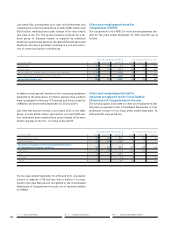
As part of the Company ’s One Siemens framework for sustain-
able value creation, Siemens continues to use an indicator in
order to optimize the capital structure. A key consideration in
this regard is to continue Siemens’ ready access to capital mar-
kets through various debt products and maintaining the Com-
pany ’s ability to repay and service its debt obligations over
time. Siemens set a capital structure target range of . – ..
The ratio is defined as the item Adjusted industrial net debt di-
vided by the item Adjusted EBITDA. The calculation of the item
Adjusted industrial net debt is set forth in the table below. Ad-
justed EBITDA is defined as adjusted earnings before income
taxes (EBIT) before amortization (defined as amortization and
impairments, net of reversals, of intangible assets other than
goodwill) and depreciation and impairments of property, plant
and equipment and goodwill. Adjusted EBIT is defined as line
item Income from continuing operations before income taxes
less line item Interest income, less line item Interest expense
less line item Other financial income (expense), net as well as
less line item Income (loss) from investments accounted for
using the equity method, net.
September ,
(in millions of €)
Short-term debt and current maturities
of long-term debt 3,826 3,660
Plus: Long-term debt
16,880 14,280
Less: Cash and cash equivalents (10,891) (12,468)
Less: Current available-for-sale financial assets (524) (477)
Net debt 9,292 4,995
Less: SFS Debt (14,558) (12,075)
Plus: Pension plans and similar commitments 9,926 7,307
Plus: Credit guarantees 326 591
Less: % nominal amount hybrid bond (920) (883)
Less: Fair value hedge accounting
adjustment (1,670) (1,470)
Adjusted industrial net debt 2,396 (1,534)
Adjusted EBITDA
(continuing operations) 9,788 10,701
Adjusted industrial net debt / adjusted EBITDA
(continuing operations) 0.24 (0.14)
1 Item Short-term debt and current maturities of long-term debt as well as item
Long-term debt include, in total, adjustments for fair value hedge accounting of
€, million and €, million, respectively, as of September , and .
2 The adjustment considers that both Moody ’s and Standard & Poor ’s view SFS as a
captive finance company. These rating agencies generally recognize and accept
higher levels of debt attributable to captive finance subsidiaries in determining
credit ratings. Following this concept, we exclude SFS Debt in order to derive an
adjusted industrial net debt which is not affected by SFS’s financing activities
3 To reflect Siemens’ total pension liability, adjusted industrial net debt includes line
item Pension plans and similar commitments as presented in the Consolidated
Statements of Financial Position.
4 In accordance with calculations made by Siemens’ rating agencies, Siemens adjusts
the hybrid bond in order to classify % as equity and % as debt, which reflects
the characteristics of the hybrid bond such as a long maturity date and subordina-
tion to all senior and debt obligations.
5 Debt is generally reported at a value representing approximately the amount to be
repaid. Under IFRS, debt designated in a hedging relationship (fair value hedges) is
adjusted for changes in market value, which mainly result from changes in interest
rates. Those adjustments are reversed to derive an approximated amount of debt
to be repaid. Siemens believes this to be a more meaningful figure in computing
adjusted industrial net debt.
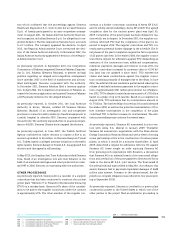
A key factor in maintaining a strong financial profile is Siemens’
credit rating which is affected by, among other factors,
Siemens’ capital structure, profitability, ability to generate cash
flow, geographic and product diversification as well as
Siemens’ competitive market position. Siemens’ current corpo-
rate credit ratings from Moody ’s Investors Service and Stan-
dard & Poor’s Ratings Services’ (S&P) are noted as follows:
September , September ,
Moody’s
Investors
Service S&P
Moody’s
Investors
Service S&P
Long-term debt Aa3 A+ A1 A+
Short-term debt P-1 A-1+ P-1 A-1+
On June , , Moody ’s raised its long-term Siemens’ credit
rating from A to Aa. The rating classification Aa is the second
highest rating within Moody ’s debt ratings category. The nu-
merical modifier indicates a ranking in the lower end of that
rating category. At the same time Moody ’s revised its outlook
for Siemens’ credit rating from positive to stable. The Moody ’s
rating outlook is an opinion regarding the likely direction of an
issuer’s rating over the medium-term. Rating outlooks of
Moody ’s fall into the following six categories: positive, nega-
tive, stable, developing, ratings under review and no outlook.
Moody ’s announced that the rating action was prompted by
the higher levels of profitability and cash flow leverage that
the Company has been able to achieve over the past few years,
and Moody ’s assessment that these levels are likely to be sus-
tainable through economic cycles, including the current peri-
od of economic weakness in Europe.
Moody ’s rating for Siemens’ short-term corporate credit and
commercial paper is P-, the highest available rating in the
prime rating system, which assesses issuers’ ability to honor
senior financial obligations and contracts. It applies to senior
unsecured obligations with an original maturity of less than
one year. On June , Moody ’s affirmed Siemens’ P- short-
term rating.
S&P’s rating for Siemens’ long-term credit rating is A+. Within
S&P’s ratings definitions an obligation rated A has the third
highest long-term rating category. The modifier + indicates
that the long-term debt ranks in the upper end of the A catego-
ry. S&P’s outlook for Siemens’ credit rating was positive. A rat-
ing outlook indicates the potential direction of a long-term
credit rating over the medium-term. Rating outlooks of S&P’s
fall into the following four categories: positive, negative, sta-
ble and developing.