Siemens 2012 Annual Report Download - page 270
Download and view the complete annual report
Please find page 270 of the 2012 Siemens annual report below. You can navigate through the pages in the report by either clicking on the pages listed below, or by using the keyword search tool below to find specific information within the annual report.-
 1
1 -
2
-
3
-
4
-
5
-
6
-
7
-
8
-
9
-
10
-
11
-
12
-
13
-
14
-
15
-
16
-
17
-
18
-
19
-
20
-
21
-
22
-
23
-
24
-
25
-
26
-
27
-
28
-
29
-
30
-
31
-
32
-
33
-
34
-
35
-
36
-
37
-
38
-
39
-
40
-
41
-
42
-
43
-
44
-
45
-
46
-
47
-
48
-
49
-
50
-
51
-
52
-
53
-
54
-
55
-
56
-
57
-
58
-
59
-
60
-
61
-
62
-
63
-
64
-
65
-
66
-
67
-
68
-
69
-
70
-
71
-
72
-
73
-
74
-
75
-
76
-
77
-
78
-
79
-
80
-
81
-
82
-
83
-
84
-
85
-
86
-
87
-
88
-
89
-
90
-
91
-
92
-
93
-
94
-
95
-
96
-
97
-
98
-
99
-
100
-
101
-
102
-
103
-
104
-
105
-
106
-
107
-
108
-
109
-
110
-
111
-
112
-
113
-
114
-
115
-
116
-
117
-
118
-
119
-
120
-
121
-
122
-
123
-
124
-
125
-
126
-
127
-
128
-
129
-
130
-
131
-
132
-
133
-
134
-
135
-
136
-
137
-
138
-
139
-
140
-
141
-
142
-
143
-
144
-
145
-
146
-
147
-
148
-
149
-
150
-
151
-
152
-
153
-
154
-
155
-
156
-
157
-
158
-
159
-
160
-
161
-
162
-
163
-
164
-
165
-
166
-
167
-
168
-
169
-
170
-
171
-
172
-
173
-
174
-
175
-
176
-
177
-
178
-
179
-
180
-
181
-
182
-
183
-
184
-
185
-
186
-
187
-
188
-
189
-
190
-
191
-
192
-
193
-
194
-
195
-
196
-
197
-
198
-
199
-
200
-
201
-
202
-
203
-
204
-
205
-
206
-
207
-
208
-
209
-
210
-
211
-
212
-
213
-
214
-
215
-
216
-
217
-
218
-
219
-
220
-
221
-
222
-
223
-
224
-
225
-
226
-
227
-
228
-
229
-
230
-
231
-
232
-
233
-
234
-
235
-
236
-
237
-
238
-
239
-
240
-
241
-
242
-
243
-
244
-
245
-
246
-
247
-
248
-
249
-
250
-
251
-
252
-
253
-
254
-
255
-
256
-
257
-
258
-
259
-
 260
260 -
 261
261 -
 262
262 -
 263
263 -
 264
264 -
 265
265 -
 266
266 -
 267
267 -
 268
268 -
 269
269 -
 270
270 -
 271
271 -
 272
272 -
 273
273 -
 274
274 -
 275
275 -
 276
276 -
 277
277 -
 278
278 -
 279
279 -
 280
280 -
281
-
282
-
283
-
284
-
285
-
286
-
287
-
288
-
289
-
290
-
291
-
292
-
293
-
294
-
295
-
296
-
297
-
298
-
299
-
300
-
301
-
302
-
303
-
304
-
305
-
306
-
307
-
308
-
309
-
310
-
311
-
312
-
313
-
314
-
315
-
316
-
317
-
318
-
319
-
320
-
321
-
322
-
323
-
324
-
325
-
326
-
327
-
328
-
329
-
330
-
331
-
332
-
333
-
334
-
335
-
336
-
337
-
338
-
339
-
340
-
341
-
342
-
343
-
344
 |
 |

1 A. To our Shareholders 49 C. Combined Management Report 21 B. Corporate Governance
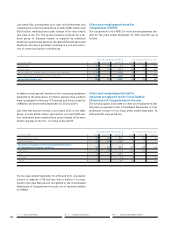
The following table shows the actual return on plan assets in
fiscal and :
Year ended September ,
(in millions of €) Total Domestic Foreign
Actual return on plan assets 3,390 2,323 1,067
Year ended September ,
(in millions of €) Total Domestic Foreign
Actual return on plan assets (178) (471) 293
Amounts presented for the year ended September , , in
the table above include amounts related to OSRAM. Amounts
presented for the year ended September , include
amounts related to Siemens IT Solutions and Services and
OSRAM.
The actual return over the last twelve months amounted to
.% or , million compared to an expected return of .%
or €, million. The experience adjustment arising on plan
assets was .% in fiscal (fiscal : (.)%; fiscal :
.%; fiscal : .%; fiscal : (.)%). For the domestic
pension plans, €, million or .% was realized, as com-
pared to an expected return on plan assets of .% or an
amount of € million that was included in the NPBC. For the
foreign pension plans, € million or .% was realized, as
compared to an expected return on plan assets of .% or an
amount of € million that was included in the NPBC.
Pension benefits: pension benefit payments
The following overview comprises pension benefits paid out of
the pension benefit plans during the years ended September
, and , and expected pension payments for the
next five years and in the aggregate for the five years thereaf-
ter (undiscounted):
(in millions of €) Total Domestic Foreign
Pension benefits paid
2011 1,553 1,005 548
2012 1,538 1,011 527
Expected pension payments
2013 1,578 1,001 577
2014 1,552 999 553
2015 1,570 1,007 563
2016 1,587 1,008 579
2017 1,614 1,020 594
2018 – 2022 8,422 5,261 3,161
Pension benefits paid by OSRAM for the year ended September
, , which are not included in the table above, amounted
to € million. Amounts presented for the year ended Septem-
ber , , in the table above include amounts related to
Siemens IT Solutions and Services and OSRAM.
As pension benefit payments for Siemens’ funded pension
benefit plans reduce the DBO and plan assets by the same
amount, there is no impact on the funded status of such plans.
-
In Germany, employees who entered into the Company ’s em-
ployment on or before September , , are entitled to tran-
sition payments for the first six months after retirement equal
to the difference between their final compensation and the re-
tirement benefits payable under the corporate pension plan.
Certain foreign companies, primarily in the U.S. and Canada,
provide other post-employment benefits in the form of medi-
cal, dental and life insurance. The amount of obligations for
other post-employment benefits in the form of medical and
dental benefits specifically depends on the expected cost trend
in the healthcare sector. To be entitled to such healthcare ben-
efits, participants must contribute to the insurance premiums.
Participant contributions are based on specific regulations
of cost sharing which are defined in the benefit plans. The
Company has the right to adjust the cost allocation at any
time, generally this is done on an annual basis. Premiums for
life insurance benefits are paid solely by the Company.
The Company ’s other post-employment benefits are illustrated
in detail in the subsequent sections with regard to:
> Obligations, plan assets and funded status,
> Plan assets,
> Components of NPBC,
> Amounts recognized in the Consolidated
Statements of Comprehensive Income,
> Assumptions used in the calculation of
the DBO and the NPBC,
> Sensitivity analysis, and
> Benefit payments.