Siemens 2012 Annual Report Download - page 177
Download and view the complete annual report
Please find page 177 of the 2012 Siemens annual report below. You can navigate through the pages in the report by either clicking on the pages listed below, or by using the keyword search tool below to find specific information within the annual report.-
 1
1 -
2
-
3
-
4
-
5
-
6
-
7
-
8
-
9
-
10
-
11
-
12
-
13
-
14
-
15
-
16
-
17
-
18
-
19
-
20
-
21
-
22
-
23
-
24
-
25
-
26
-
27
-
28
-
29
-
30
-
31
-
32
-
33
-
34
-
35
-
36
-
37
-
38
-
39
-
40
-
41
-
42
-
43
-
44
-
45
-
46
-
47
-
48
-
49
-
50
-
51
-
52
-
53
-
54
-
55
-
56
-
57
-
58
-
59
-
60
-
61
-
62
-
63
-
64
-
65
-
66
-
67
-
68
-
69
-
70
-
71
-
72
-
73
-
74
-
75
-
76
-
77
-
78
-
79
-
80
-
81
-
82
-
83
-
84
-
85
-
86
-
87
-
88
-
89
-
90
-
91
-
92
-
93
-
94
-
95
-
96
-
97
-
98
-
99
-
100
-
101
-
102
-
103
-
104
-
105
-
106
-
107
-
108
-
109
-
110
-
111
-
112
-
113
-
114
-
115
-
116
-
117
-
118
-
119
-
120
-
121
-
122
-
123
-
124
-
125
-
126
-
127
-
128
-
129
-
130
-
131
-
132
-
133
-
134
-
135
-
136
-
137
-
138
-
139
-
140
-
141
-
142
-
143
-
144
-
145
-
146
-
147
-
148
-
149
-
150
-
151
-
152
-
153
-
154
-
155
-
156
-
157
-
158
-
159
-
160
-
161
-
162
-
163
-
164
-
165
-
166
-
 167
167 -
 168
168 -
 169
169 -
 170
170 -
 171
171 -
 172
172 -
 173
173 -
 174
174 -
 175
175 -
 176
176 -
 177
177 -
 178
178 -
 179
179 -
 180
180 -
 181
181 -
 182
182 -
 183
183 -
 184
184 -
 185
185 -
 186
186 -
 187
187 -
188
-
189
-
190
-
191
-
192
-
193
-
194
-
195
-
196
-
197
-
198
-
199
-
200
-
201
-
202
-
203
-
204
-
205
-
206
-
207
-
208
-
209
-
210
-
211
-
212
-
213
-
214
-
215
-
216
-
217
-
218
-
219
-
220
-
221
-
222
-
223
-
224
-
225
-
226
-
227
-
228
-
229
-
230
-
231
-
232
-
233
-
234
-
235
-
236
-
237
-
238
-
239
-
240
-
241
-
242
-
243
-
244
-
245
-
246
-
247
-
248
-
249
-
250
-
251
-
252
-
253
-
254
-
255
-
256
-
257
-
258
-
259
-
260
-
261
-
262
-
263
-
264
-
265
-
266
-
267
-
268
-
269
-
270
-
271
-
272
-
273
-
274
-
275
-
276
-
277
-
278
-
279
-
280
-
281
-
282
-
283
-
284
-
285
-
286
-
287
-
288
-
289
-
290
-
291
-
292
-
293
-
294
-
295
-
296
-
297
-
298
-
299
-
300
-
301
-
302
-
303
-
304
-
305
-
306
-
307
-
308
-
309
-
310
-
311
-
312
-
313
-
314
-
315
-
316
-
317
-
318
-
319
-
320
-
321
-
322
-
323
-
324
-
325
-
326
-
327
-
328
-
329
-
330
-
331
-
332
-
333
-
334
-
335
-
336
-
337
-
338
-
339
-
340
-
341
-
342
-
343
-
344
 |
 |

135 D. Consolidated Financial Statements
239 E. Additional Information
130 C. Siemens AG (Discussion on basis of
German Commercial Code)
134 C. Notes and forward-looking statements
129 C. Compensation Report, Corporate Governance
statement pursuant to Section a of the
German Commercial Code, Takeover-relevant
information and explanatory report
lents as well as current Available-for-sale financial assets, as
stated on the Consolidated Statements of Financial Position.
Net debt results from total debt less total liquidity. Manage-
ment uses the Net debt measure for internal corporate finance
management, as well as for external communication with in-
vestors, analysts and rating agencies, and accordingly we be-
lieve that presentation of Net debt is useful for those con-
cerned. Net debt should not, however, be considered in isola-
tion or as an alternative to short-term debt and long-term debt
as presented in accordance with IFRS. For further information
about the usefulness and limitations of Net debt, see .
- .
(in millions of €)
Year ended September ,
Short-term debt and current maturities
of long-term debt 3,826 3,660
Long-term debt 16,880 14,280
Total debt 20,707 17,940
Cash and cash equivalents (10,891) (12,468)
Available-for-sale financial assets (current) (524) (477)
Total liquidity (11,415) (12,945)
Net debt 9,292 4,995
1 We typically need a considerable portion of our cash and cash equivalents as well
as current available-for-sale financial assets at any given time for purposes other
than debt reduction. The deduction of these items from total debt in the calcula-
tion of Net debt therefore should not be understood to mean that these items are
available exclusively for debt reduction at any given time. Net debt comprises items
as stated on . .
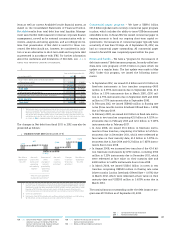
The changes in Net debt from fiscal to may also be
presented as follows:
Commercial paper program – We have a US$. billion
(€. billion) global multi-currency commercial paper program
in place, which includes the ability to issue US$-denominated
extendible notes. In fiscal we issued commercial paper in
varying amounts to fund our ongoing short-term capital re-
quirements. Our issuances of commercial paper typically have
a maturity of less than days. As of September , , we
had no commercial paper outstanding. All commercial paper
issued in fiscal was completely repaid within the year.
Notes and bonds – We have a “program for the issuance of
debt instruments” (debt issuance program, formerly called me-
dium-term note program) of €. billion in place which we
update on a regular basis. The last update was made in May
. Under this program, we issued the following instru-
ments:
> In September , we issued €. billion and £. billion in
fixed-rate instruments in four tranches comprising €
million in .% instruments due in September , €.
billion in .% instruments due in March , £ mil-
lion in .% instruments due in September and £
million in .% instruments due in September .
> In February , we issued US$ million in floating rate
notes (three months London Interbank Offered Rate + .%)
due in February .
> In February , we issued €. billion in fixed-rate instru-
ments in two tranches comprising €. billion in .% in-
struments due in February and €. billion in .%
instruments due in February .
> In June , we issued €. billion in fixed-rate instru-
ments in three tranches, comprising: €. billion in .% in-
struments due in December , which were redeemed at
face value on their maturity date; €. billion in .% in-
struments due in June and €. billion in .% instru-
ments due in June .
> In August , we increased two tranches of the €. bil-
lion fixed-rate instruments by € million, including €
million in .% instruments due in December , which
were redeemed at face value on their maturity date and
€ million in .% instruments due in June .
> In March , we issued US$. billion in notes in two
tranches comprising US$ million in floating rate notes
(three months London Interbank Offered Rate + .%) due
in March , which were redeemed at face value on their
maturity date and US$ million in .% notes due in
March .
The nominal amount outstanding under the debt issuance pro-
gram was €. billion as of September , .
( )
1 In fiscal , net cash used in the build-up of operating net working capital included
net cash used in inventories less advance payments received of € million, net cash
provided by trade and other receivables of € million, net cash provided by trade
payables of € million and net cash used in billings in excess of costs and in
estimated earnings on incompleted contracts and related advances of € million.
2 Continuing operations.
3 Included in fiscal primarily cash outflows related to dividends paid of totaling
€. billion and to purchase of common stock of €. billion.
4,995
697
(7,693)
5,034
6,259 9,292
Net debt at
September
,
Net cash
used in the
build-up of
operating
net working
capital
Income and
other
changes in
net cash
provided by
operating
activities
Total net cash provided
by operating activities
Net cash
used in
investing
activities
Changes
in certain
financing
activities
Net debt at
September
,