Siemens 2012 Annual Report Download - page 266
Download and view the complete annual report
Please find page 266 of the 2012 Siemens annual report below. You can navigate through the pages in the report by either clicking on the pages listed below, or by using the keyword search tool below to find specific information within the annual report.-
 1
1 -
2
-
3
-
4
-
5
-
6
-
7
-
8
-
9
-
10
-
11
-
12
-
13
-
14
-
15
-
16
-
17
-
18
-
19
-
20
-
21
-
22
-
23
-
24
-
25
-
26
-
27
-
28
-
29
-
30
-
31
-
32
-
33
-
34
-
35
-
36
-
37
-
38
-
39
-
40
-
41
-
42
-
43
-
44
-
45
-
46
-
47
-
48
-
49
-
50
-
51
-
52
-
53
-
54
-
55
-
56
-
57
-
58
-
59
-
60
-
61
-
62
-
63
-
64
-
65
-
66
-
67
-
68
-
69
-
70
-
71
-
72
-
73
-
74
-
75
-
76
-
77
-
78
-
79
-
80
-
81
-
82
-
83
-
84
-
85
-
86
-
87
-
88
-
89
-
90
-
91
-
92
-
93
-
94
-
95
-
96
-
97
-
98
-
99
-
100
-
101
-
102
-
103
-
104
-
105
-
106
-
107
-
108
-
109
-
110
-
111
-
112
-
113
-
114
-
115
-
116
-
117
-
118
-
119
-
120
-
121
-
122
-
123
-
124
-
125
-
126
-
127
-
128
-
129
-
130
-
131
-
132
-
133
-
134
-
135
-
136
-
137
-
138
-
139
-
140
-
141
-
142
-
143
-
144
-
145
-
146
-
147
-
148
-
149
-
150
-
151
-
152
-
153
-
154
-
155
-
156
-
157
-
158
-
159
-
160
-
161
-
162
-
163
-
164
-
165
-
166
-
167
-
168
-
169
-
170
-
171
-
172
-
173
-
174
-
175
-
176
-
177
-
178
-
179
-
180
-
181
-
182
-
183
-
184
-
185
-
186
-
187
-
188
-
189
-
190
-
191
-
192
-
193
-
194
-
195
-
196
-
197
-
198
-
199
-
200
-
201
-
202
-
203
-
204
-
205
-
206
-
207
-
208
-
209
-
210
-
211
-
212
-
213
-
214
-
215
-
216
-
217
-
218
-
219
-
220
-
221
-
222
-
223
-
224
-
225
-
226
-
227
-
228
-
229
-
230
-
231
-
232
-
233
-
234
-
235
-
236
-
237
-
238
-
239
-
240
-
241
-
242
-
243
-
244
-
245
-
246
-
247
-
248
-
249
-
250
-
251
-
252
-
253
-
254
-
255
-
 256
256 -
 257
257 -
 258
258 -
 259
259 -
 260
260 -
 261
261 -
 262
262 -
 263
263 -
 264
264 -
 265
265 -
 266
266 -
 267
267 -
 268
268 -
 269
269 -
 270
270 -
 271
271 -
 272
272 -
 273
273 -
 274
274 -
 275
275 -
 276
276 -
277
-
278
-
279
-
280
-
281
-
282
-
283
-
284
-
285
-
286
-
287
-
288
-
289
-
290
-
291
-
292
-
293
-
294
-
295
-
296
-
297
-
298
-
299
-
300
-
301
-
302
-
303
-
304
-
305
-
306
-
307
-
308
-
309
-
310
-
311
-
312
-
313
-
314
-
315
-
316
-
317
-
318
-
319
-
320
-
321
-
322
-
323
-
324
-
325
-
326
-
327
-
328
-
329
-
330
-
331
-
332
-
333
-
334
-
335
-
336
-
337
-
338
-
339
-
340
-
341
-
342
-
343
-
344
 |
 |

1 A. To our Shareholders 49 C. Combined Management Report 21 B. Corporate Governance
September , September ,
(in millions of €) Total Domestic Foreign Total Domestic Foreign
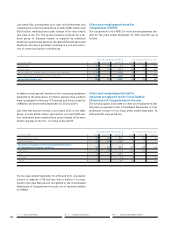
Change in defined benefit obligations:
Defined benefit obligation at beginning of year 28,721 17,147 11,574 31,475 18,897 12,578
Foreign currency exchange rate changes 523 – 523 234 – 234
Service cost 446 319 127 491 316 175
Interest cost 1,318 806 512 1,292 768 524
Settlements and curtailments (25) – (25) (970) (18) (952)
Plan participants’ contributions 119 64 55 137 81 56
Amendments and other 165 – 165 98 20 78
Actuarial (gains) losses 5,212 3,359 1,853 (1,766) (1,611) (155)
Acquisitions 82 6 76 46 25 21
Benefits paid (1,617) (1,040) (577) (1,553) (1,005) (548)
Divestments (29) (5) (24) (763) (326) (437)
Reclassification to assets and to liabilities associated
with assets classified as held for disposal for OSRAM (1,895) (658) (1,237) (1,600) (523) (1,077)
Defined benefit obligation at end of year 33,020 19,999 13,021 27,121 16,624 10,497
Germany 19,999 19,999 16,624 16,624
U.S. 4,091 4,091 3,429 3,429
U.K. 4,006 4,006 3,053 3,053
Other 4,924 4,924 4,015 4,015
September , September ,
(in millions of €) Total Domestic Foreign Total Domestic Foreign
Change in plan assets:
Fair value of plan assets at beginning of year 22,193 12,700 9,493 24,107 14,059 10,048
Foreign currency exchange rate changes 486 – 486 208 – 208
Expected return on plan assets 1,390 790 600 1,475 886 589
Actuarial gains (losses) on plan assets 2,000 1,533 467 (1,653) (1,357) (296)
Acquisitions and other 198 1 197 79 1 78
Settlements (19) – (19) (773) – (773)
Employer contributions 730 376 354 849 276 573
Plan participants' contributions 119 64 55 137 81 56
Benefits paid (1,530) (998) (532) (1,470) (973) (497)
Divestments and other (36) – (36) (766) (273) (493)
Reclassification to assets and to liabilities associated
with assets classified as held for disposal for OSRAM (1,480) (509) (971) (1,228) (391) (837)
Fair value of plan assets at end of year 24,052 13,956 10,096 20,965 12,309 8,656
Germany 13,956 13,956 12,309 12,309
U.S. 2,815 2,815 2,346 2,346
U.K. 3,758 3,758 3,201 3,201
Other 3,523 3,523 3,109 3,109