Siemens 2012 Annual Report Download - page 289
Download and view the complete annual report
Please find page 289 of the 2012 Siemens annual report below. You can navigate through the pages in the report by either clicking on the pages listed below, or by using the keyword search tool below to find specific information within the annual report.-
 1
1 -
2
-
3
-
4
-
5
-
6
-
7
-
8
-
9
-
10
-
11
-
12
-
13
-
14
-
15
-
16
-
17
-
18
-
19
-
20
-
21
-
22
-
23
-
24
-
25
-
26
-
27
-
28
-
29
-
30
-
31
-
32
-
33
-
34
-
35
-
36
-
37
-
38
-
39
-
40
-
41
-
42
-
43
-
44
-
45
-
46
-
47
-
48
-
49
-
50
-
51
-
52
-
53
-
54
-
55
-
56
-
57
-
58
-
59
-
60
-
61
-
62
-
63
-
64
-
65
-
66
-
67
-
68
-
69
-
70
-
71
-
72
-
73
-
74
-
75
-
76
-
77
-
78
-
79
-
80
-
81
-
82
-
83
-
84
-
85
-
86
-
87
-
88
-
89
-
90
-
91
-
92
-
93
-
94
-
95
-
96
-
97
-
98
-
99
-
100
-
101
-
102
-
103
-
104
-
105
-
106
-
107
-
108
-
109
-
110
-
111
-
112
-
113
-
114
-
115
-
116
-
117
-
118
-
119
-
120
-
121
-
122
-
123
-
124
-
125
-
126
-
127
-
128
-
129
-
130
-
131
-
132
-
133
-
134
-
135
-
136
-
137
-
138
-
139
-
140
-
141
-
142
-
143
-
144
-
145
-
146
-
147
-
148
-
149
-
150
-
151
-
152
-
153
-
154
-
155
-
156
-
157
-
158
-
159
-
160
-
161
-
162
-
163
-
164
-
165
-
166
-
167
-
168
-
169
-
170
-
171
-
172
-
173
-
174
-
175
-
176
-
177
-
178
-
179
-
180
-
181
-
182
-
183
-
184
-
185
-
186
-
187
-
188
-
189
-
190
-
191
-
192
-
193
-
194
-
195
-
196
-
197
-
198
-
199
-
200
-
201
-
202
-
203
-
204
-
205
-
206
-
207
-
208
-
209
-
210
-
211
-
212
-
213
-
214
-
215
-
216
-
217
-
218
-
219
-
220
-
221
-
222
-
223
-
224
-
225
-
226
-
227
-
228
-
229
-
230
-
231
-
232
-
233
-
234
-
235
-
236
-
237
-
238
-
239
-
240
-
241
-
242
-
243
-
244
-
245
-
246
-
247
-
248
-
249
-
250
-
251
-
252
-
253
-
254
-
255
-
256
-
257
-
258
-
259
-
260
-
261
-
262
-
263
-
264
-
265
-
266
-
267
-
268
-
269
-
270
-
271
-
272
-
273
-
274
-
275
-
276
-
277
-
278
-
 279
279 -
 280
280 -
 281
281 -
 282
282 -
 283
283 -
 284
284 -
 285
285 -
 286
286 -
 287
287 -
 288
288 -
 289
289 -
 290
290 -
 291
291 -
 292
292 -
 293
293 -
 294
294 -
 295
295 -
 296
296 -
 297
297 -
 298
298 -
 299
299 -
300
-
301
-
302
-
303
-
304
-
305
-
306
-
307
-
308
-
309
-
310
-
311
-
312
-
313
-
314
-
315
-
316
-
317
-
318
-
319
-
320
-
321
-
322
-
323
-
324
-
325
-
326
-
327
-
328
-
329
-
330
-
331
-
332
-
333
-
334
-
335
-
336
-
337
-
338
-
339
-
340
-
341
-
342
-
343
-
344
 |
 |

135 D. Consolidated Financial Statements 239 E. Additional Information
140 D. Consolidated Statements of Changes in Equity
142 D. Notes to Consolidated Financial Statements
232 D. Supervisory Board and Managing Board
136 D. Consolidated Statements of Income
137 D. Consolidated Statements of Comprehensive Income
138 D. Consolidated Statements of Financial Position
139 D. Consolidated Statements of Cash Flow
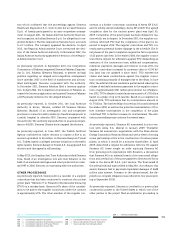
Financial instruments categorized as financial assets and fi-
nancial liabilities measured at fair value are presented in the
following table:
September ,
(in millions of €)
Financial assets measured at fair value
Available-for-sale financial assets 1,252 939
Derivative financial instruments 3,328 3,022
Not designated in a hedge
accounting relationship 1,202 1,148
In connection with fair value hedges 1,783 1,575
Foreign currency exchange derivatives 22 3
Interest rate derivatives 1,761 1,572
In connection with cash flow hedges 135 132
Foreign currency exchange derivatives 132 132
Commodity derivatives 3–
Embedded derivatives 208 167
4,580 3,961
Financial liabilities measured at fair value
Derivative financial instruments 1,125 1,605
Not designated in a hedge
accounting relationship 823 1,253
In connection with fair value hedges 11 8
Foreign currency exchange derivatives 28
Interest rate derivatives 9–
In connection with cash flow hedges 193 247
Foreign currency exchange derivatives 185 207
Interest rate derivatives 813
Commodity derivatives –27
Embedded derivatives 98 97
1,125 1,605
Fair values of available-for-sale financial assets are derived
from quoted market prices in active markets.
The Company limits default risks resulting from derivative fi-
nancial instruments by a careful counterparty selection. Deriv-
ative financial instruments are generally transacted with finan-
cial institutions with investment grade credit ratings. The fair
valuation of derivative financial instruments at Siemens incor-
porates all factors that market participants would consider, in-
cluding the counterparties’ credit risks. The exact calculation
of fair values of derivative financial instruments depends on
the specific type of instrument:
Derivative interest rate contracts – The fair values of derivative
interest rate contracts (e.g. interest rate swap agreements) are
estimated by discounting expected future cash flows using
current market interest rates and yield curves over the remain-
ing term of the instrument. Interest rate futures and interest
rate options are valued on the basis of quoted market prices
when available. If quoted market prices are not available, inter-
est rate options are valued based on option pricing models.
Derivative currency contracts – The fair value of foreign cur-
rency exchange contracts is based on forward exchange rates.
Currency options are valued on the basis of quoted market
prices or on estimates based on option pricing models.
Derivative commodity contracts – The fair value of commodity
swaps is based on forward commodity prices. Commodity
options are valued on the basis of quoted market prices or on
estimates based on option pricing models.
In determining the fair values of the derivative financial in-
struments, no compensating effects from underlying transac-
tions (e.g. firm commitments and forecast transactions) are
taken into consideration.
The following table allocates financial assets and financial
liabilities measured at fair value to the three levels of the fair
value hierarchy.
September ,
(in millions of €) Level Level Level Total
Financial assets
measured at fair value
Available-for-sale financial assets 1,252 – – 1,252
Derivative financial instruments – 3,328 – 3,328
Total 1,252 3,328 – 4,580
Financial liabilities
measured at fair value
Derivative financial instruments – 1,125 – 1,125
September ,
Level Level Level Total
Financial assets
measured at fair value
Available-for-sale financial assets 939 – – 939
Derivative financial instruments – 3,022 – 3,022
Total 939 3,022 – 3,961
Financial liabilities
measured at fair value
Derivative financial instruments 8 1,597 – 1,605