Siemens 2012 Annual Report Download - page 305
Download and view the complete annual report
Please find page 305 of the 2012 Siemens annual report below. You can navigate through the pages in the report by either clicking on the pages listed below, or by using the keyword search tool below to find specific information within the annual report.-
 1
1 -
2
-
3
-
4
-
5
-
6
-
7
-
8
-
9
-
10
-
11
-
12
-
13
-
14
-
15
-
16
-
17
-
18
-
19
-
20
-
21
-
22
-
23
-
24
-
25
-
26
-
27
-
28
-
29
-
30
-
31
-
32
-
33
-
34
-
35
-
36
-
37
-
38
-
39
-
40
-
41
-
42
-
43
-
44
-
45
-
46
-
47
-
48
-
49
-
50
-
51
-
52
-
53
-
54
-
55
-
56
-
57
-
58
-
59
-
60
-
61
-
62
-
63
-
64
-
65
-
66
-
67
-
68
-
69
-
70
-
71
-
72
-
73
-
74
-
75
-
76
-
77
-
78
-
79
-
80
-
81
-
82
-
83
-
84
-
85
-
86
-
87
-
88
-
89
-
90
-
91
-
92
-
93
-
94
-
95
-
96
-
97
-
98
-
99
-
100
-
101
-
102
-
103
-
104
-
105
-
106
-
107
-
108
-
109
-
110
-
111
-
112
-
113
-
114
-
115
-
116
-
117
-
118
-
119
-
120
-
121
-
122
-
123
-
124
-
125
-
126
-
127
-
128
-
129
-
130
-
131
-
132
-
133
-
134
-
135
-
136
-
137
-
138
-
139
-
140
-
141
-
142
-
143
-
144
-
145
-
146
-
147
-
148
-
149
-
150
-
151
-
152
-
153
-
154
-
155
-
156
-
157
-
158
-
159
-
160
-
161
-
162
-
163
-
164
-
165
-
166
-
167
-
168
-
169
-
170
-
171
-
172
-
173
-
174
-
175
-
176
-
177
-
178
-
179
-
180
-
181
-
182
-
183
-
184
-
185
-
186
-
187
-
188
-
189
-
190
-
191
-
192
-
193
-
194
-
195
-
196
-
197
-
198
-
199
-
200
-
201
-
202
-
203
-
204
-
205
-
206
-
207
-
208
-
209
-
210
-
211
-
212
-
213
-
214
-
215
-
216
-
217
-
218
-
219
-
220
-
221
-
222
-
223
-
224
-
225
-
226
-
227
-
228
-
229
-
230
-
231
-
232
-
233
-
234
-
235
-
236
-
237
-
238
-
239
-
240
-
241
-
242
-
243
-
244
-
245
-
246
-
247
-
248
-
249
-
250
-
251
-
252
-
253
-
254
-
255
-
256
-
257
-
258
-
259
-
260
-
261
-
262
-
263
-
264
-
265
-
266
-
267
-
268
-
269
-
270
-
271
-
272
-
273
-
274
-
275
-
276
-
277
-
278
-
279
-
280
-
281
-
282
-
283
-
284
-
285
-
286
-
287
-
288
-
289
-
290
-
291
-
292
-
293
-
294
-
 295
295 -
 296
296 -
 297
297 -
 298
298 -
 299
299 -
 300
300 -
 301
301 -
 302
302 -
 303
303 -
 304
304 -
 305
305 -
 306
306 -
 307
307 -
 308
308 -
 309
309 -
 310
310 -
 311
311 -
 312
312 -
 313
313 -
 314
314 -
 315
315 -
316
-
317
-
318
-
319
-
320
-
321
-
322
-
323
-
324
-
325
-
326
-
327
-
328
-
329
-
330
-
331
-
332
-
333
-
334
-
335
-
336
-
337
-
338
-
339
-
340
-
341
-
342
-
343
-
344
 |
 |

135 D. Consolidated Financial Statements 239 E. Additional Information
140 D. Consolidated Statements of Changes in Equity
142 D. Notes to Consolidated Financial Statements
232 D. Supervisory Board and Managing Board
136 D. Consolidated Statements of Income
137 D. Consolidated Statements of Comprehensive Income
138 D. Consolidated Statements of Financial Position
139 D. Consolidated Statements of Cash Flow
For the years ended September , and , Profit of SFS
includes interest income of € million and € million, re-
spectively and interest expense of € million and € mil-
lion, respectively.
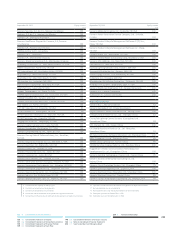
Information about geographies
Revenue by
location of customer
Revenue by
location of companies
(in millions of €)
Europe, C.I.S., Africa,
Middle East 39,909 38,448 44,895 43,508
Americas 22,864 20,470 22,587 19,908
Asia, Australia 15,523 14,357 10,814 9,859
Siemens 78,296 73,275 78,296 73,275
thereof Germany 11,072 10,810 19,948 19,502
thereof foreign countries 67,224 62,465 58,348 53,773
thereof U.S. 16,670 14,368 17,840 15,487
Non-current assets
September ,
(in millions of €)
Europe, C.I.S., Africa, Middle East 16,009 15,238
Americas 13,723 12,921
Asia, Australia 2,695 2,468
Siemens 32,427 30,627
thereof Germany 6,446 6,351
thereof U.S. 12,133 11,713
Non-current assets consist of property, plant and equipment,
goodwill and other intangible assets.
Related party transactions
Siemens has relationships with many joint ventures and asso-
ciates in the ordinary course of business whereby Siemens
buys and sells a wide variety of products and services general-
ly on arm’s length terms. For information regarding our subsid-
iaries, joint ventures and associated companies in fiscal
see
and
. -
. Information regarding our subsidiaries, joint
ventures and associated companies for fiscal are presented
in the List of subsidiaries and associated companies published
separately in the German Electronic Federal Gazette (elek-
tronischer Bundesanzeiger).
Sales of goods and services and other income from transac-
tions with joint ventures and associates as well as purchases
of goods and services and other expense from transactions
with joint ventures and associates are as follows:
Sales of goods and services
and other income
Year ended September ,
Purchases of goods and
services and other expense
Year ended September ,
(in millions of €)
Joint ventures 423 225 11 35
Associates 513 584 228 259
936 809 239 293
Receivables from joint ventures and associates and liabilities
to joint ventures and associates are as follows:
Receivables
September ,
Liabilities
September ,
(in millions of €)
Joint ventures 49 52 23 76
Associates 145 120 241 234
194 172 264 310
As of September , and , loans given to joint ven-
tures and associates amounted to € million and € mil-
lion, respectively. In December , Siemens and Nokia Cor-
poration each converted € million of liabilities into pre-
ferred NSN shares; the liabilities included the remaining share-
holder loan tranche of nominal € million as well as deferred
interest due from NSN. In the fourth quarter of fiscal , in
order to strengthen NSN’s financial position, Nokia and
Siemens each provided new equity of € million and re-
ceived preferred shares in return. The increase in equity did
not change the existing shareholder ratio between Siemens
and Nokia Corporation. Loans given to joint ventures amount-
ed to € million and € million, respectively, as of September
, and . In the normal course of business the Com-
pany regularly reviews loans and receivables associated with
joint ventures and associates, including NSN. In fiscal and
, the review resulted in net gains related to valuation al-
lowances totaling € million and net losses related to valuation