Siemens 2012 Annual Report Download - page 89
Download and view the complete annual report
Please find page 89 of the 2012 Siemens annual report below. You can navigate through the pages in the report by either clicking on the pages listed below, or by using the keyword search tool below to find specific information within the annual report.-
 1
1 -
2
-
3
-
4
-
5
-
6
-
7
-
8
-
9
-
10
-
11
-
12
-
13
-
14
-
15
-
16
-
17
-
18
-
19
-
20
-
21
-
22
-
23
-
24
-
25
-
26
-
27
-
28
-
29
-
30
-
31
-
32
-
33
-
34
-
35
-
36
-
37
-
38
-
39
-
40
-
41
-
42
-
43
-
44
-
45
-
46
-
47
-
48
-
49
-
50
-
51
-
52
-
53
-
54
-
55
-
56
-
57
-
58
-
59
-
60
-
61
-
62
-
63
-
64
-
65
-
66
-
67
-
68
-
69
-
70
-
71
-
72
-
73
-
74
-
75
-
76
-
77
-
78
-
 79
79 -
 80
80 -
 81
81 -
 82
82 -
 83
83 -
 84
84 -
 85
85 -
 86
86 -
 87
87 -
 88
88 -
 89
89 -
 90
90 -
 91
91 -
 92
92 -
 93
93 -
 94
94 -
 95
95 -
 96
96 -
 97
97 -
 98
98 -
 99
99 -
100
-
101
-
102
-
103
-
104
-
105
-
106
-
107
-
108
-
109
-
110
-
111
-
112
-
113
-
114
-
115
-
116
-
117
-
118
-
119
-
120
-
121
-
122
-
123
-
124
-
125
-
126
-
127
-
128
-
129
-
130
-
131
-
132
-
133
-
134
-
135
-
136
-
137
-
138
-
139
-
140
-
141
-
142
-
143
-
144
-
145
-
146
-
147
-
148
-
149
-
150
-
151
-
152
-
153
-
154
-
155
-
156
-
157
-
158
-
159
-
160
-
161
-
162
-
163
-
164
-
165
-
166
-
167
-
168
-
169
-
170
-
171
-
172
-
173
-
174
-
175
-
176
-
177
-
178
-
179
-
180
-
181
-
182
-
183
-
184
-
185
-
186
-
187
-
188
-
189
-
190
-
191
-
192
-
193
-
194
-
195
-
196
-
197
-
198
-
199
-
200
-
201
-
202
-
203
-
204
-
205
-
206
-
207
-
208
-
209
-
210
-
211
-
212
-
213
-
214
-
215
-
216
-
217
-
218
-
219
-
220
-
221
-
222
-
223
-
224
-
225
-
226
-
227
-
228
-
229
-
230
-
231
-
232
-
233
-
234
-
235
-
236
-
237
-
238
-
239
-
240
-
241
-
242
-
243
-
244
-
245
-
246
-
247
-
248
-
249
-
250
-
251
-
252
-
253
-
254
-
255
-
256
-
257
-
258
-
259
-
260
-
261
-
262
-
263
-
264
-
265
-
266
-
267
-
268
-
269
-
270
-
271
-
272
-
273
-
274
-
275
-
276
-
277
-
278
-
279
-
280
-
281
-
282
-
283
-
284
-
285
-
286
-
287
-
288
-
289
-
290
-
291
-
292
-
293
-
294
-
295
-
296
-
297
-
298
-
299
-
300
-
301
-
302
-
303
-
304
-
305
-
306
-
307
-
308
-
309
-
310
-
311
-
312
-
313
-
314
-
315
-
316
-
317
-
318
-
319
-
320
-
321
-
322
-
323
-
324
-
325
-
326
-
327
-
328
-
329
-
330
-
331
-
332
-
333
-
334
-
335
-
336
-
337
-
338
-
339
-
340
-
341
-
342
-
343
-
344
 |
 |

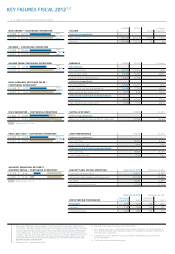
Energy Revenue € 27.537 billion
Profit € 2.159 billion
Our Energy Sector offers a wide spectrum of products, services and
solutions for the generation and transmission of power, and the extrac-
tion, conversion and transport of oil and gas. It primarily addresses
the needs of energy providers, but also serves industrial companies,
particularly in the oil and gas industry.
Industry Revenue € 20.508 billion
Profit € 2.467 billion
Our Industry Sector offers a broad spectrum of products, services
and solutions for the efficient use of resources and energy and im-
provements of productivity and flexibility in industry. Its integrated
technologies and holistic solutions address primarily industrial cus-
tomers, such as process and manufacturing industries. The portfolio
spans industry automation, industrial software and drives products
and services, system integration and solutions for industrial plant
businesses. After the close of fiscal , the Sector decided to
dispose of its business with mechanical, biological and chemical
treatment and processing of water.
Financial Services Profit € 479 million
Total assets € 17.405 billion
Financial Services (SFS) provides a variety of financial services and
products both to third parties and to other Siemens entities and their
customers. SFS has three strategic pillars: supporting Siemens’ Sectors
with financing solutions for their customers, manage financial risks of
Siemens and offering third-party financing services and products.
Equity Investments Profit € (549) million
In general, the segment Equity Investments comprises equity stakes
held by Siemens that are accounted for by the equity method, at cost
or as current available-for-sale financial assets and are not allocated
to a Sector, SFS, Centrally managed portfolio activities, Siemens Real
Estate (SRE), Corporate items or Corporate Treasury for strategic
reasons. Our main investments within Equity Investments are our
stake of approximately .% in Nokia Siemens Networks B.V. (NSN),
our .% stake in BSH Bosch und Siemens Hausgeräte GmbH (BSH)
as well as our .% stake in Enterprise Networks Holdings B.V. (EN).
Infrastructure & Cities Revenue € 17.585 billion
Profit € 1.102 billion
Our Infrastructure & Cities Sector offers a wide range of sustainable
technologies for metropolitan centers and urban infrastructures
worldwide, such as integrated mobility solutions, building and secu-
rity systems, power distribution equipment, smart grid applications
and low- and medium-voltage products.
Healthcare Revenue € 13.642 billion
Profit € 1.815 billion
Our Healthcare Sector offers customers a comprehensive portfolio of
medical solutions across the treatment chain – ranging from medical
imaging to in vitro diagnostics to interventional systems and clinical
information technology systems – all from a single source. In addi-
tion, the Sector provides technical maintenance, professional and
consulting services, and, together with Financial Services (SFS),
financing to assist customers in purchasing the Sector’s products.
(
,
)