Siemens 2012 Annual Report Download - page 175
Download and view the complete annual report
Please find page 175 of the 2012 Siemens annual report below. You can navigate through the pages in the report by either clicking on the pages listed below, or by using the keyword search tool below to find specific information within the annual report.-
 1
1 -
2
-
3
-
4
-
5
-
6
-
7
-
8
-
9
-
10
-
11
-
12
-
13
-
14
-
15
-
16
-
17
-
18
-
19
-
20
-
21
-
22
-
23
-
24
-
25
-
26
-
27
-
28
-
29
-
30
-
31
-
32
-
33
-
34
-
35
-
36
-
37
-
38
-
39
-
40
-
41
-
42
-
43
-
44
-
45
-
46
-
47
-
48
-
49
-
50
-
51
-
52
-
53
-
54
-
55
-
56
-
57
-
58
-
59
-
60
-
61
-
62
-
63
-
64
-
65
-
66
-
67
-
68
-
69
-
70
-
71
-
72
-
73
-
74
-
75
-
76
-
77
-
78
-
79
-
80
-
81
-
82
-
83
-
84
-
85
-
86
-
87
-
88
-
89
-
90
-
91
-
92
-
93
-
94
-
95
-
96
-
97
-
98
-
99
-
100
-
101
-
102
-
103
-
104
-
105
-
106
-
107
-
108
-
109
-
110
-
111
-
112
-
113
-
114
-
115
-
116
-
117
-
118
-
119
-
120
-
121
-
122
-
123
-
124
-
125
-
126
-
127
-
128
-
129
-
130
-
131
-
132
-
133
-
134
-
135
-
136
-
137
-
138
-
139
-
140
-
141
-
142
-
143
-
144
-
145
-
146
-
147
-
148
-
149
-
150
-
151
-
152
-
153
-
154
-
155
-
156
-
157
-
158
-
159
-
160
-
161
-
162
-
163
-
164
-
 165
165 -
 166
166 -
 167
167 -
 168
168 -
 169
169 -
 170
170 -
 171
171 -
 172
172 -
 173
173 -
 174
174 -
 175
175 -
 176
176 -
 177
177 -
 178
178 -
 179
179 -
 180
180 -
 181
181 -
 182
182 -
 183
183 -
 184
184 -
 185
185 -
186
-
187
-
188
-
189
-
190
-
191
-
192
-
193
-
194
-
195
-
196
-
197
-
198
-
199
-
200
-
201
-
202
-
203
-
204
-
205
-
206
-
207
-
208
-
209
-
210
-
211
-
212
-
213
-
214
-
215
-
216
-
217
-
218
-
219
-
220
-
221
-
222
-
223
-
224
-
225
-
226
-
227
-
228
-
229
-
230
-
231
-
232
-
233
-
234
-
235
-
236
-
237
-
238
-
239
-
240
-
241
-
242
-
243
-
244
-
245
-
246
-
247
-
248
-
249
-
250
-
251
-
252
-
253
-
254
-
255
-
256
-
257
-
258
-
259
-
260
-
261
-
262
-
263
-
264
-
265
-
266
-
267
-
268
-
269
-
270
-
271
-
272
-
273
-
274
-
275
-
276
-
277
-
278
-
279
-
280
-
281
-
282
-
283
-
284
-
285
-
286
-
287
-
288
-
289
-
290
-
291
-
292
-
293
-
294
-
295
-
296
-
297
-
298
-
299
-
300
-
301
-
302
-
303
-
304
-
305
-
306
-
307
-
308
-
309
-
310
-
311
-
312
-
313
-
314
-
315
-
316
-
317
-
318
-
319
-
320
-
321
-
322
-
323
-
324
-
325
-
326
-
327
-
328
-
329
-
330
-
331
-
332
-
333
-
334
-
335
-
336
-
337
-
338
-
339
-
340
-
341
-
342
-
343
-
344
 |
 |

135 D. Consolidated Financial Statements
239 E. Additional Information
130 C. Siemens AG (Discussion on basis of
German Commercial Code)
134 C. Notes and forward-looking statements
129 C. Compensation Report, Corporate Governance
statement pursuant to Section a of the
German Commercial Code, Takeover-relevant
information and explanatory report
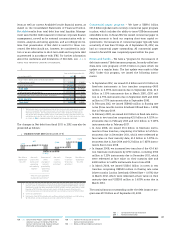
Continuing operations Discontinued operations Continuing and
discontinued operations
Year ended September , Year ended September , Year ended September ,
(in millions of €)
Net cash provided by (used in):
Operating activities 6,996 8,081 (24) (314) 6,972 7,767
Investing activities (5,034) (2,739) (650) (1,305) (5,685) (4,044)
therein: Additions to intangible assets and
property, plant and equipment (2,206) (2,163) (204) (454) (2,410) (2,617)
Free cash flow 4,790 5,918 (228) (768) 4,562 5,150
Financing activities (3,591) (7,062) 674 1,619 (2,916) (5,443)
1 The closest comparable financial measure of Free cash flow under IFRS is Net cash
provided by (used in) operating activities. Net cash provided by (used in) operating
activities from continuing operations as well as from continuing and discontinued
operations is reported in . . Other
companies that report Free cash flow may define and calculate this measure differently.
We report Free cash flow as a supplemental liquidity measure,
which is defined as net cash provided by (used in) operating
activities less cash used for additions to intangible assets and
property, plant and equipment. We believe that the presenta-
tion of Free cash flow provides useful information to investors
because it gives an indication of the long-term cash-generat-
ing ability of our business and our ability to pay for discretion-
ary and non-discretionary expenditures not included in the
measure, such as dividends, debt repayment or acquisitions.
We also use Free cash flow to compare cash generation among
the segments of our business. Free cash flow should not be
considered in isolation or as an alternative to measures of cash
flow calculated in accordance with IFRS. For further informa-
tion about the usefulness and limitations of this measure, see
. - .
Cash flows from operating activities – Continuing opera-
tions provided net cash of €. billion in fiscal , com-
pared to net cash provided of €. billion in the same period
a year earlier. In the current period income from continuing
operations was €. billion. Therein included were amortiza-
tion, depreciation and impairments of €. billion. A build-
up of operating net working capital reduced the cash inflows
by €. billion. The increase in operating net working capital
was due mainly to a decrease in billings in excess of costs and
estimated earnings on uncompleted contracts and related ad-
vances primarily in the Energy Sector due in part to lower or-
ders year-over-year. The current period also included cash out-
flows of approximately €. billion related to the revaluation of
the commercial feasibility of Healthcare’s particle therapy
business for general patient treatment as well as Healthcare’s
Agenda initiative. In the prior-year period income from
continuing operations was €. billion. Therein included
were amortization, depreciation and impairments of €.
billion. Income from continuing operations also included the
Areva NP disposal gain of €. billion, partly offset by the
negative impact of € million related to an adverse arbitra-
tion decision associated with Siemens’ decision to exit its nu-
clear power joint venture with Areva, which was deducted in
the Consolidated Statements of Cash Flow within the line item
(Gains) losses on sales of investments, net. A build-up of oper-
ating net working capital in the prior-year period reduced cash
inflows near the level of fiscal .
Discontinued operations used net cash of € million in fiscal
, compared to net cash used of € million in the prior-
year period. The largest factor of the decrease in cash outflows
year-over-year was lower cash outflows related to Siemens IT
Solutions and Services, which a year earlier included higher
payments in connection with the establishment of Siemens IT
Solutions and Services as a separate legal group, including for
carve-out activities and personnel-related matters.
Cash flows from investing activities – Net cash used in in-
vesting activities for continuing operations amounted to
€. billion in fiscal compared to net cash used of
€. billion in the prior-year period. The increase in cash out-
flows from investing activities was due mainly to lower pro-
ceeds from sales of investments, intangibles and property,
plant and equipment of €. billion; to higher acquisitions,
net of cash acquired, of €. billion; and to the higher build-
up in receivables from financing activities of € million relat-
ing to SFS’s asset growth strategy. Proceeds of € million in
the current period from the sales of investments, intangibles
and property, plant and equipment included the sale of our
% interest in OAO Power Machines, held by the Energy Sector.
In the prior-year period, proceeds from sales of investments,
intangibles and property, plant and equipment provided net
cash of €. billion. This total included proceeds from the
sale of investments of €. billion, mainly related to the sale
of our Areva NP stake for €. billion in the second quarter of
fiscal , subsequently reduced by €. billion in the third
quarter of fiscal due to the arbitration decision mentioned
earlier, and the sale of our % minority stake in KMW. Cash