Siemens 2012 Annual Report Download - page 268
Download and view the complete annual report
Please find page 268 of the 2012 Siemens annual report below. You can navigate through the pages in the report by either clicking on the pages listed below, or by using the keyword search tool below to find specific information within the annual report.-
 1
1 -
2
-
3
-
4
-
5
-
6
-
7
-
8
-
9
-
10
-
11
-
12
-
13
-
14
-
15
-
16
-
17
-
18
-
19
-
20
-
21
-
22
-
23
-
24
-
25
-
26
-
27
-
28
-
29
-
30
-
31
-
32
-
33
-
34
-
35
-
36
-
37
-
38
-
39
-
40
-
41
-
42
-
43
-
44
-
45
-
46
-
47
-
48
-
49
-
50
-
51
-
52
-
53
-
54
-
55
-
56
-
57
-
58
-
59
-
60
-
61
-
62
-
63
-
64
-
65
-
66
-
67
-
68
-
69
-
70
-
71
-
72
-
73
-
74
-
75
-
76
-
77
-
78
-
79
-
80
-
81
-
82
-
83
-
84
-
85
-
86
-
87
-
88
-
89
-
90
-
91
-
92
-
93
-
94
-
95
-
96
-
97
-
98
-
99
-
100
-
101
-
102
-
103
-
104
-
105
-
106
-
107
-
108
-
109
-
110
-
111
-
112
-
113
-
114
-
115
-
116
-
117
-
118
-
119
-
120
-
121
-
122
-
123
-
124
-
125
-
126
-
127
-
128
-
129
-
130
-
131
-
132
-
133
-
134
-
135
-
136
-
137
-
138
-
139
-
140
-
141
-
142
-
143
-
144
-
145
-
146
-
147
-
148
-
149
-
150
-
151
-
152
-
153
-
154
-
155
-
156
-
157
-
158
-
159
-
160
-
161
-
162
-
163
-
164
-
165
-
166
-
167
-
168
-
169
-
170
-
171
-
172
-
173
-
174
-
175
-
176
-
177
-
178
-
179
-
180
-
181
-
182
-
183
-
184
-
185
-
186
-
187
-
188
-
189
-
190
-
191
-
192
-
193
-
194
-
195
-
196
-
197
-
198
-
199
-
200
-
201
-
202
-
203
-
204
-
205
-
206
-
207
-
208
-
209
-
210
-
211
-
212
-
213
-
214
-
215
-
216
-
217
-
218
-
219
-
220
-
221
-
222
-
223
-
224
-
225
-
226
-
227
-
228
-
229
-
230
-
231
-
232
-
233
-
234
-
235
-
236
-
237
-
238
-
239
-
240
-
241
-
242
-
243
-
244
-
245
-
246
-
247
-
248
-
249
-
250
-
251
-
252
-
253
-
254
-
255
-
256
-
257
-
 258
258 -
 259
259 -
 260
260 -
 261
261 -
 262
262 -
 263
263 -
 264
264 -
 265
265 -
 266
266 -
 267
267 -
 268
268 -
 269
269 -
 270
270 -
 271
271 -
 272
272 -
 273
273 -
 274
274 -
 275
275 -
 276
276 -
 277
277 -
 278
278 -
279
-
280
-
281
-
282
-
283
-
284
-
285
-
286
-
287
-
288
-
289
-
290
-
291
-
292
-
293
-
294
-
295
-
296
-
297
-
298
-
299
-
300
-
301
-
302
-
303
-
304
-
305
-
306
-
307
-
308
-
309
-
310
-
311
-
312
-
313
-
314
-
315
-
316
-
317
-
318
-
319
-
320
-
321
-
322
-
323
-
324
-
325
-
326
-
327
-
328
-
329
-
330
-
331
-
332
-
333
-
334
-
335
-
336
-
337
-
338
-
339
-
340
-
341
-
342
-
343
-
344
 |
 |

1 A. To our Shareholders 49 C. Combined Management Report 21 B. Corporate Governance
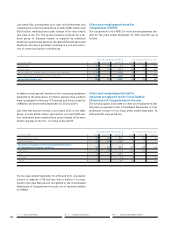
Pension benefits: amounts recognized in the
Consolidated Statements of Comprehensive
Income
The actuarial gains and losses on defined benefit pension
plans recognized in the Consolidated Statements of Compre-
hensive Income for the fiscal years ended September ,
and were as follows:
For the years ended September , and , cumulative in-
come or expense of € million and €() million is recognized in
line item Net amount recognized in the Consolidated Statements
of Comprehensive Income, net of tax which relates to OSRAM.
Pension benefits: assumptions
for the calculation of the DBO and NPBC
Assumed discount rates, compensation increase rates and
pension progression rates used in calculating the DBO together
Year ended September , Year ended September ,
(in millions of €) Total Domestic Foreign Total Domestic Foreign
Actuarial losses (gains) 3,023 1,725 1,298 (113) (254) 141
Effects in connection with asset ceiling 2 – 2 18 – 18
Income tax effect (1,216) (869) (347) 146 227 (81)
Net amount recognized in the Consolidated Statements
of Comprehensive Income, net of tax 1,809 856 953 51 (27) 78
Germany 856 856 (27) (27)
U.S. 198 198 228 228
U.K. 376 376 (208) (208)
Other 379 379 58 58
with long-term rates of return on plan assets vary according to
the economic conditions of the country in which the retire-
ment plans are situated or where plan assets are invested as
well as capital market expectations.
The weighted-average discount rate used for the actuarial val-
uation of the DBO at period-end and the expected return on
plan assets for the fiscal year ending at period-end were as
follows:
Year ended September , Year ended September ,
Total Domestic Foreign Total Domestic Foreign
Discount rate 3.2% 3.1% 3.3% 4.5% 4.7% 4.3%
Germany 3.1% 3.1% 4.7% 4.7%
U.S. 2.90% 2.90% 4.10% 4.10%
U.K. 4.4% 4.4% 5.7% 5.7%
Expected return on plan assets 6.3% 6.5% 6.1% 6.3% 6.5% 6.1%
Germany 6.5% 6.5% 6.5% 6.5%
U.S. 6.96% 6.96% 6.95% 6.95%
U.K. 6.0% 6.0% 6.0% 6.0%
The rates of compensation increase for countries with signifi-
cant effects with regard to this assumption were as follows for
the years ended September , and : U.S.: .% and
.%, U.K. .% and .%, Switzerland: .% and .%,
Netherlands: .% and .%. The compensation increase
rate for the domestic pension plans for the year ended Sep-
tember , , was .% (: .%). However, due to the
implementation of the BSAV, the effect of the compensation
increase on the domestic pension plans is substantially elimi-
nated. The rates of pension progression for countries with sig-
nificant effects with regard to this assumption were as follows
for the years ended September , and : Germany:
.% and .%, U.K.: .% and .%.