Siemens 2012 Annual Report Download - page 167
Download and view the complete annual report
Please find page 167 of the 2012 Siemens annual report below. You can navigate through the pages in the report by either clicking on the pages listed below, or by using the keyword search tool below to find specific information within the annual report.-
 1
1 -
2
-
3
-
4
-
5
-
6
-
7
-
8
-
9
-
10
-
11
-
12
-
13
-
14
-
15
-
16
-
17
-
18
-
19
-
20
-
21
-
22
-
23
-
24
-
25
-
26
-
27
-
28
-
29
-
30
-
31
-
32
-
33
-
34
-
35
-
36
-
37
-
38
-
39
-
40
-
41
-
42
-
43
-
44
-
45
-
46
-
47
-
48
-
49
-
50
-
51
-
52
-
53
-
54
-
55
-
56
-
57
-
58
-
59
-
60
-
61
-
62
-
63
-
64
-
65
-
66
-
67
-
68
-
69
-
70
-
71
-
72
-
73
-
74
-
75
-
76
-
77
-
78
-
79
-
80
-
81
-
82
-
83
-
84
-
85
-
86
-
87
-
88
-
89
-
90
-
91
-
92
-
93
-
94
-
95
-
96
-
97
-
98
-
99
-
100
-
101
-
102
-
103
-
104
-
105
-
106
-
107
-
108
-
109
-
110
-
111
-
112
-
113
-
114
-
115
-
116
-
117
-
118
-
119
-
120
-
121
-
122
-
123
-
124
-
125
-
126
-
127
-
128
-
129
-
130
-
131
-
132
-
133
-
134
-
135
-
136
-
137
-
138
-
139
-
140
-
141
-
142
-
143
-
144
-
145
-
146
-
147
-
148
-
149
-
150
-
151
-
152
-
153
-
154
-
155
-
156
-
 157
157 -
 158
158 -
 159
159 -
 160
160 -
 161
161 -
 162
162 -
 163
163 -
 164
164 -
 165
165 -
 166
166 -
 167
167 -
 168
168 -
 169
169 -
 170
170 -
 171
171 -
 172
172 -
 173
173 -
 174
174 -
 175
175 -
 176
176 -
 177
177 -
178
-
179
-
180
-
181
-
182
-
183
-
184
-
185
-
186
-
187
-
188
-
189
-
190
-
191
-
192
-
193
-
194
-
195
-
196
-
197
-
198
-
199
-
200
-
201
-
202
-
203
-
204
-
205
-
206
-
207
-
208
-
209
-
210
-
211
-
212
-
213
-
214
-
215
-
216
-
217
-
218
-
219
-
220
-
221
-
222
-
223
-
224
-
225
-
226
-
227
-
228
-
229
-
230
-
231
-
232
-
233
-
234
-
235
-
236
-
237
-
238
-
239
-
240
-
241
-
242
-
243
-
244
-
245
-
246
-
247
-
248
-
249
-
250
-
251
-
252
-
253
-
254
-
255
-
256
-
257
-
258
-
259
-
260
-
261
-
262
-
263
-
264
-
265
-
266
-
267
-
268
-
269
-
270
-
271
-
272
-
273
-
274
-
275
-
276
-
277
-
278
-
279
-
280
-
281
-
282
-
283
-
284
-
285
-
286
-
287
-
288
-
289
-
290
-
291
-
292
-
293
-
294
-
295
-
296
-
297
-
298
-
299
-
300
-
301
-
302
-
303
-
304
-
305
-
306
-
307
-
308
-
309
-
310
-
311
-
312
-
313
-
314
-
315
-
316
-
317
-
318
-
319
-
320
-
321
-
322
-
323
-
324
-
325
-
326
-
327
-
328
-
329
-
330
-
331
-
332
-
333
-
334
-
335
-
336
-
337
-
338
-
339
-
340
-
341
-
342
-
343
-
344
 |
 |

135 D. Consolidated Financial Statements
239 E. Additional Information
130 C. Siemens AG (Discussion on basis of
German Commercial Code)
134 C. Notes and forward-looking statements
129 C. Compensation Report, Corporate Governance
statement pursuant to Section a of the
German Commercial Code, Takeover-relevant
information and explanatory report
... &
Profit at Infrastructure & Cities came in at €. billion, down
slightly year-over-year. While the Power Grid Solutions & Prod-
ucts business and the Building Technologies Division both im-
proved profit year-over-year, profit at Transportation & Logistics
declined substantially due mainly to € million in charges at
a rolling stock project in Germany. Profit development for the
Sector was also held back by € million in charges related to
severance programs. These negative effects were partly offset
by a positive € million contribution from the Sector’s inter-
est in AtoS and the Sector’s € million portion of the OPEB
gain mentioned earlier. For comparison, profit in fiscal
was burdened by the Sector’s € million share of a special
employee remuneration allocation.
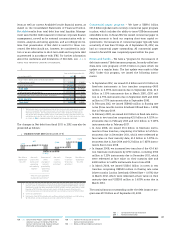
Year ended September , % Change therein
(in millions of €) Actual Adjusted Currency Portfolio
Profit 1,102 , ()%
Profit margin 6.3% .%
New orders 17,150 , ()% ()% % %
Total revenue 17,585 , % % % %
External revenue 16,731 , %
therein:
Europe, C.I.S., Africa, Middle East 10,121 , %
therein Germany 2,880 , ()%
Americas 4,344 , %
Asia, Australia 2,267 , ()%
1 Excluding currency translation and portfolio effects. 2 Commonwealth of Independent States.
Revenue grew moderately year-over-year, as higher revenue in
the regions America and Europe, C.I.S., Africa, Middle East
more than offset a decline in Asia, Australia. Revenue growth
was driven by Power Grid Solutions & Products and Building
Technologies. Revenue at Transportation & Logistics declined
slightly year-over-year. Orders for the Sector decreased %
compared to the prior year, which included a sharply higher
volume from major orders at Transportation & Logistics. This
included Siemens’ largest-ever train order in Germany, worth
€. billion, and a major order for high-speed trains in the U.K.
As a result, fiscal orders came in substantially lower in
Europe, C.I.S., Africa, Middle East. Order intake was also clearly
lower in Asia, Australia, only partly offset by a slight increase
in the Americas. On a book-to-bill ratio of ., Infrastruc-
ture & Cities’ order backlog was € billion at the end of fiscal
, unchanged from a year earlier.
Year ended September , % Change therein
(in millions of €) Actual Adjusted Currency Portfolio
Transportation & Logistics 5,382 10,052 (46)% (48)% 1% 0%
Power Grid Solutions & Products 6,275 5,905 6% 4% 2% 0%
Building Technologies 5,809 5,597 4% 0% 3% 0%
1 Excluding currency translation and portfolio effects.
Year ended September , % Change therein
(in millions of €) Actual Adjusted Currency Portfolio
Transportation & Logistics 5,969 6,041 (1)% (4)% 2% 0%
Power Grid Solutions & Products 6,068 5,657 7% 5% 2% 0%
Building Technologies 5,820 5,468 6% 3% 3% 0%
1 Excluding currency translation and portfolio effects.