Siemens 2012 Annual Report Download - page 170
Download and view the complete annual report
Please find page 170 of the 2012 Siemens annual report below. You can navigate through the pages in the report by either clicking on the pages listed below, or by using the keyword search tool below to find specific information within the annual report.-
 1
1 -
2
-
3
-
4
-
5
-
6
-
7
-
8
-
9
-
10
-
11
-
12
-
13
-
14
-
15
-
16
-
17
-
18
-
19
-
20
-
21
-
22
-
23
-
24
-
25
-
26
-
27
-
28
-
29
-
30
-
31
-
32
-
33
-
34
-
35
-
36
-
37
-
38
-
39
-
40
-
41
-
42
-
43
-
44
-
45
-
46
-
47
-
48
-
49
-
50
-
51
-
52
-
53
-
54
-
55
-
56
-
57
-
58
-
59
-
60
-
61
-
62
-
63
-
64
-
65
-
66
-
67
-
68
-
69
-
70
-
71
-
72
-
73
-
74
-
75
-
76
-
77
-
78
-
79
-
80
-
81
-
82
-
83
-
84
-
85
-
86
-
87
-
88
-
89
-
90
-
91
-
92
-
93
-
94
-
95
-
96
-
97
-
98
-
99
-
100
-
101
-
102
-
103
-
104
-
105
-
106
-
107
-
108
-
109
-
110
-
111
-
112
-
113
-
114
-
115
-
116
-
117
-
118
-
119
-
120
-
121
-
122
-
123
-
124
-
125
-
126
-
127
-
128
-
129
-
130
-
131
-
132
-
133
-
134
-
135
-
136
-
137
-
138
-
139
-
140
-
141
-
142
-
143
-
144
-
145
-
146
-
147
-
148
-
149
-
150
-
151
-
152
-
153
-
154
-
155
-
156
-
157
-
158
-
159
-
 160
160 -
 161
161 -
 162
162 -
 163
163 -
 164
164 -
 165
165 -
 166
166 -
 167
167 -
 168
168 -
 169
169 -
 170
170 -
 171
171 -
 172
172 -
 173
173 -
 174
174 -
 175
175 -
 176
176 -
 177
177 -
 178
178 -
 179
179 -
 180
180 -
181
-
182
-
183
-
184
-
185
-
186
-
187
-
188
-
189
-
190
-
191
-
192
-
193
-
194
-
195
-
196
-
197
-
198
-
199
-
200
-
201
-
202
-
203
-
204
-
205
-
206
-
207
-
208
-
209
-
210
-
211
-
212
-
213
-
214
-
215
-
216
-
217
-
218
-
219
-
220
-
221
-
222
-
223
-
224
-
225
-
226
-
227
-
228
-
229
-
230
-
231
-
232
-
233
-
234
-
235
-
236
-
237
-
238
-
239
-
240
-
241
-
242
-
243
-
244
-
245
-
246
-
247
-
248
-
249
-
250
-
251
-
252
-
253
-
254
-
255
-
256
-
257
-
258
-
259
-
260
-
261
-
262
-
263
-
264
-
265
-
266
-
267
-
268
-
269
-
270
-
271
-
272
-
273
-
274
-
275
-
276
-
277
-
278
-
279
-
280
-
281
-
282
-
283
-
284
-
285
-
286
-
287
-
288
-
289
-
290
-
291
-
292
-
293
-
294
-
295
-
296
-
297
-
298
-
299
-
300
-
301
-
302
-
303
-
304
-
305
-
306
-
307
-
308
-
309
-
310
-
311
-
312
-
313
-
314
-
315
-
316
-
317
-
318
-
319
-
320
-
321
-
322
-
323
-
324
-
325
-
326
-
327
-
328
-
329
-
330
-
331
-
332
-
333
-
334
-
335
-
336
-
337
-
338
-
339
-
340
-
341
-
342
-
343
-
344
 |
 |

1 A. To our Shareholders
21 B. Corporate Governance 49 C. Combined Management Report
50 C. Business and economic environment
64 C. Financial performance measures
69 C. Results of operations
82 C. Financial position
93 C. Net assets position
95 C. Overall assessment of the economic position
96 C. Subsequent events
97 C. Sustainability
111 C. Report on expected developments and
associated material opportunities and risks
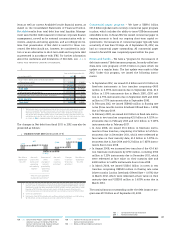
The following table gives additional information on topics in-
cluded in Profit and Income before income taxes and provides
a reconciliation to adjusted EBITDA based on continuing opera-
tions. We report adjusted EBIT and adjusted EBITDA as a per-
formance measure. The closest comparable GAAP figure under
IFRS is Net income as reported in our “Consolidated Statements
of Income.” For further information regarding adjusted EBIT
and adjusted EBITDA, please see . -
.
,
Profit Income (loss) from investments
accounted for using the equity
method, net
(in millions of €)
Sectors
Energy Sector 2,159 4,230 87 75
therein: Fossil Power Generation 1,933 2,837 41 33
Wind Power 304 357 6(3)
Oil & Gas 218 467 ––
Power Transmission (302) 566 25 35
Healthcare Sector 1,815 1,334 89
therein: Diagnostics 314 300 ––
Industry Sector 2,467 2,752 12 19
therein: Industry Automation 1,335 1,411 28
Drive Technologies 970 1,158 10 7
Infrastructure & Cities Sector 1,102 1,126 25 18
therein: Transportation & Logistics 236 365 15 11
Power Grid Solutions & Products 457 413 97
Building Technologies 379 364 11
Total Sectors 7,543 9,442 133 121
Equity Investments (549) (26) (568) (44)
Financial Services (SFS) 479 428 168 92
Reconciliation to Consolidated Financial Statements
Centrally managed portfolio activities (29) (40) 712
Siemens Real Estate (SRE) 115 150 ––
Corporate items and pensions (302) (257) ––
Eliminations, Corporate Treasury and other reconciling items 23 (90) (5) 29
Siemens 7,279 9,608 (266) 210
1 Profit of the Sectors as well as of Equity Investments and Centrally managed portfolio
activities is earnings before financing interest, certain pension costs and income taxes.
Certain other items not considered performance indicative by Management may be
excluded. Profit of SFS and SRE is Income before income taxes. Profit of Siemens is
Income from continuing operations before income taxes. For a reconciliation of Income
from continuing operations before income taxes to Net income see
.
.
2 Includes impairments and reversals of impairments of investments accounted for using
the equity method.
3 Includes impairment of non-current available-for-sale financial assets. For Siemens,
Financial income (expense), net comprises Interest income, Interest expense and Other
financial income (expense), net as reported in the Consolidated Statements of Income.
.. Reconciliation to adjusted EBITDA (continuing operations)