Siemens 2012 Annual Report Download - page 174
Download and view the complete annual report
Please find page 174 of the 2012 Siemens annual report below. You can navigate through the pages in the report by either clicking on the pages listed below, or by using the keyword search tool below to find specific information within the annual report.-
 1
1 -
2
-
3
-
4
-
5
-
6
-
7
-
8
-
9
-
10
-
11
-
12
-
13
-
14
-
15
-
16
-
17
-
18
-
19
-
20
-
21
-
22
-
23
-
24
-
25
-
26
-
27
-
28
-
29
-
30
-
31
-
32
-
33
-
34
-
35
-
36
-
37
-
38
-
39
-
40
-
41
-
42
-
43
-
44
-
45
-
46
-
47
-
48
-
49
-
50
-
51
-
52
-
53
-
54
-
55
-
56
-
57
-
58
-
59
-
60
-
61
-
62
-
63
-
64
-
65
-
66
-
67
-
68
-
69
-
70
-
71
-
72
-
73
-
74
-
75
-
76
-
77
-
78
-
79
-
80
-
81
-
82
-
83
-
84
-
85
-
86
-
87
-
88
-
89
-
90
-
91
-
92
-
93
-
94
-
95
-
96
-
97
-
98
-
99
-
100
-
101
-
102
-
103
-
104
-
105
-
106
-
107
-
108
-
109
-
110
-
111
-
112
-
113
-
114
-
115
-
116
-
117
-
118
-
119
-
120
-
121
-
122
-
123
-
124
-
125
-
126
-
127
-
128
-
129
-
130
-
131
-
132
-
133
-
134
-
135
-
136
-
137
-
138
-
139
-
140
-
141
-
142
-
143
-
144
-
145
-
146
-
147
-
148
-
149
-
150
-
151
-
152
-
153
-
154
-
155
-
156
-
157
-
158
-
159
-
160
-
161
-
162
-
163
-
 164
164 -
 165
165 -
 166
166 -
 167
167 -
 168
168 -
 169
169 -
 170
170 -
 171
171 -
 172
172 -
 173
173 -
 174
174 -
 175
175 -
 176
176 -
 177
177 -
 178
178 -
 179
179 -
 180
180 -
 181
181 -
 182
182 -
 183
183 -
 184
184 -
185
-
186
-
187
-
188
-
189
-
190
-
191
-
192
-
193
-
194
-
195
-
196
-
197
-
198
-
199
-
200
-
201
-
202
-
203
-
204
-
205
-
206
-
207
-
208
-
209
-
210
-
211
-
212
-
213
-
214
-
215
-
216
-
217
-
218
-
219
-
220
-
221
-
222
-
223
-
224
-
225
-
226
-
227
-
228
-
229
-
230
-
231
-
232
-
233
-
234
-
235
-
236
-
237
-
238
-
239
-
240
-
241
-
242
-
243
-
244
-
245
-
246
-
247
-
248
-
249
-
250
-
251
-
252
-
253
-
254
-
255
-
256
-
257
-
258
-
259
-
260
-
261
-
262
-
263
-
264
-
265
-
266
-
267
-
268
-
269
-
270
-
271
-
272
-
273
-
274
-
275
-
276
-
277
-
278
-
279
-
280
-
281
-
282
-
283
-
284
-
285
-
286
-
287
-
288
-
289
-
290
-
291
-
292
-
293
-
294
-
295
-
296
-
297
-
298
-
299
-
300
-
301
-
302
-
303
-
304
-
305
-
306
-
307
-
308
-
309
-
310
-
311
-
312
-
313
-
314
-
315
-
316
-
317
-
318
-
319
-
320
-
321
-
322
-
323
-
324
-
325
-
326
-
327
-
328
-
329
-
330
-
331
-
332
-
333
-
334
-
335
-
336
-
337
-
338
-
339
-
340
-
341
-
342
-
343
-
344
 |
 |

1 A. To our Shareholders
21 B. Corporate Governance 49 C. Combined Management Report
50 C. Business and economic environment
64 C. Financial performance measures
69 C. Results of operations
82 C. Financial position
93 C. Net assets position
95 C. Overall assessment of the economic position
96 C. Subsequent events
97 C. Sustainability
111 C. Report on expected developments and
associated material opportunities and risks
Considering the above mentioned transactions and the chang-
es in equity and debt described in . ,
the capital structure changed as follows:
(in millions of €)
Year ended September , % Change
Total equity attributable to
shareholders of Siemens AG 30,733 31,530 (3)%
As percentage of total capital 60% 64%
Short-term debt and current
maturities of long-term debt 3,826 3,660
Long-term debt 16,880 14,280
Total debt 20,707 17,940 15%
As percentage of total capital 40% 36%
Total capital
(total equity and total debt) 51,440 49,470 4%
We have commitments to sell or otherwise issue common
shares in connection with established share-based compensa-
tion plans. In fiscal , commitments for share-based com-
pensation were fulfilled through treasury shares. In fiscal ,
we may again fulfill commitments for share-based compensa-
tion through treasury shares. Amongst other purposes men-
tioned above we may therefore repurchase additional treasury
shares in fiscal . For additional information with respect to
share-based compensation see . -
.
As part of our One Siemens framework for sustainable value
creation, Siemens decided to continue to use an indicator to
evaluate its capital structure. For further information, see
. . A key consideration in
this regard is maintenance of ready access to the capital mar-
kets through various debt products and preservation of our
ability to repay and service our debt obligations over time.
Siemens set a capital structure target range of . – .. The
ratio is defined as the item Adjusted industrial net debt divid-
ed by the item Adjusted EBITDA (continuing operations). The
calculation of the item Adjusted industrial net debt is set
forth in the table below. Adjusted EBITDA (continuing opera-
tions) is defined as adjusted earnings before income taxes
(EBIT) before amortization (defined as amortization and im-
pairments, net of reversals, of intangible assets other than
goodwill) and depreciation and impairments of property,
plant and equipment and goodwill. Adjusted EBIT is defined
as the line item Income from continuing operations before in-
come taxes less the line item Interest income, less the line
item Interest expense less the line item Other financial in-
come (expense), net as well as less the line item Income
(loss) from investments accounted for using the equity
method, net. For further information, see
.. -
.
(in millions of €)
Year ended September ,
Short-term debt and current maturities
of long-term debt 3,826 3,660
Plus: Long-term debt 16,880 14,280
Less: Cash and cash equivalents (10,891) (12,468)
Less: Current available-for-sale financial assets (524) (477)
Net debt 9,292 4,995
Less: SFS Debt (14,558) (12,075)
Plus: Pension plans and similar commitments 9,926 7,307
Plus: Credit guarantees 326 591
Less: % nominal amount hybrid bond (920) (883)
Less: Fair value hedge accounting adjustment (1,670) (1,470)
Adjusted industrial net debt 2,396 (1,534)
Adjusted EBITDA (continuing operations) 9,788 10,701
Adjusted industrial net debt / adjusted EBITDA
(continuing operations) 0.24 (0.14)
1 The item Short-term debt and current maturities of long-term debt as well as the
item Long-term debt included in total fair value hedge accounting adjustments of
€, million and €, million for the fiscal year ended September , and
, respectively.
2 The adjustment considers that both Moody’s and S&P’s view SFS as a captive finance
company. These rating agencies generally recognize and accept higher levels of debt
attributable to captive finance subsidiaries in determining credit ratings. Following
this concept, we exclude SFS Debt in order to derive an adjusted industrial net debt
which is not affected by SFS’s financing activities.
3 To reflect Siemens’ total pension liability, adjusted industrial net debt includes line
item Pension plans and similar commitments as presented in .
.
4 The adjustment for our hybrid bond considers the calculation of this financial ratio
applied by rating agencies to classify % of our hybrid bond as equity and % as
debt. This assignment reflects the characteristics of our hybrid bond such as a long
maturity date and subordination to all senior and debt obligations.
5 Debt is generally reported with a value representing approximately the amount to
be repaid. However for debt designated in a hedging relationship (fair value hedges),
this amount is adjusted by changes in market value mainly due to changes in inter-
est rates. Accordingly we deduct these changes in market value in order to end
up with an amount of debt that approximately will be repaid. We believe this is a
more meaningful figure for the calculation presented above. For further information
on fair value hedges see .
.
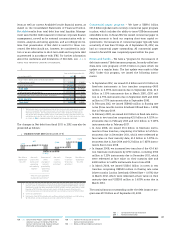
.. Cash flows
The following discussion presents an analysis of our cash
flows from operating, investing and financing activities for fis-
cal and for both continuing and discontinued opera-
tions. Discontinued operations include primarily OSRAM and
Siemens IT Solutions and Services, which were classified as
discontinued operations during the second quarter of fiscal
, and the solar business, which was classified as discontin-
ued operations during the fourth quarter of fiscal .
Siemens IT Solutions and Services was sold to AtoS in the
fourth quarter of fiscal .