Siemens 2012 Annual Report Download - page 183
Download and view the complete annual report
Please find page 183 of the 2012 Siemens annual report below. You can navigate through the pages in the report by either clicking on the pages listed below, or by using the keyword search tool below to find specific information within the annual report.-
 1
1 -
2
-
3
-
4
-
5
-
6
-
7
-
8
-
9
-
10
-
11
-
12
-
13
-
14
-
15
-
16
-
17
-
18
-
19
-
20
-
21
-
22
-
23
-
24
-
25
-
26
-
27
-
28
-
29
-
30
-
31
-
32
-
33
-
34
-
35
-
36
-
37
-
38
-
39
-
40
-
41
-
42
-
43
-
44
-
45
-
46
-
47
-
48
-
49
-
50
-
51
-
52
-
53
-
54
-
55
-
56
-
57
-
58
-
59
-
60
-
61
-
62
-
63
-
64
-
65
-
66
-
67
-
68
-
69
-
70
-
71
-
72
-
73
-
74
-
75
-
76
-
77
-
78
-
79
-
80
-
81
-
82
-
83
-
84
-
85
-
86
-
87
-
88
-
89
-
90
-
91
-
92
-
93
-
94
-
95
-
96
-
97
-
98
-
99
-
100
-
101
-
102
-
103
-
104
-
105
-
106
-
107
-
108
-
109
-
110
-
111
-
112
-
113
-
114
-
115
-
116
-
117
-
118
-
119
-
120
-
121
-
122
-
123
-
124
-
125
-
126
-
127
-
128
-
129
-
130
-
131
-
132
-
133
-
134
-
135
-
136
-
137
-
138
-
139
-
140
-
141
-
142
-
143
-
144
-
145
-
146
-
147
-
148
-
149
-
150
-
151
-
152
-
153
-
154
-
155
-
156
-
157
-
158
-
159
-
160
-
161
-
162
-
163
-
164
-
165
-
166
-
167
-
168
-
169
-
170
-
171
-
172
-
 173
173 -
 174
174 -
 175
175 -
 176
176 -
 177
177 -
 178
178 -
 179
179 -
 180
180 -
 181
181 -
 182
182 -
 183
183 -
 184
184 -
 185
185 -
 186
186 -
 187
187 -
 188
188 -
 189
189 -
 190
190 -
 191
191 -
 192
192 -
 193
193 -
194
-
195
-
196
-
197
-
198
-
199
-
200
-
201
-
202
-
203
-
204
-
205
-
206
-
207
-
208
-
209
-
210
-
211
-
212
-
213
-
214
-
215
-
216
-
217
-
218
-
219
-
220
-
221
-
222
-
223
-
224
-
225
-
226
-
227
-
228
-
229
-
230
-
231
-
232
-
233
-
234
-
235
-
236
-
237
-
238
-
239
-
240
-
241
-
242
-
243
-
244
-
245
-
246
-
247
-
248
-
249
-
250
-
251
-
252
-
253
-
254
-
255
-
256
-
257
-
258
-
259
-
260
-
261
-
262
-
263
-
264
-
265
-
266
-
267
-
268
-
269
-
270
-
271
-
272
-
273
-
274
-
275
-
276
-
277
-
278
-
279
-
280
-
281
-
282
-
283
-
284
-
285
-
286
-
287
-
288
-
289
-
290
-
291
-
292
-
293
-
294
-
295
-
296
-
297
-
298
-
299
-
300
-
301
-
302
-
303
-
304
-
305
-
306
-
307
-
308
-
309
-
310
-
311
-
312
-
313
-
314
-
315
-
316
-
317
-
318
-
319
-
320
-
321
-
322
-
323
-
324
-
325
-
326
-
327
-
328
-
329
-
330
-
331
-
332
-
333
-
334
-
335
-
336
-
337
-
338
-
339
-
340
-
341
-
342
-
343
-
344
 |
 |

135 D. Consolidated Financial Statements
239 E. Additional Information
130 C. Siemens AG (Discussion on basis of
German Commercial Code)
134 C. Notes and forward-looking statements
129 C. Compensation Report, Corporate Governance
statement pursuant to Section a of the
German Commercial Code, Takeover-relevant
information and explanatory report
During fiscal , total assets increased to €. billion, up
from €. billion the year before. Our total assets in fiscal
were influenced by positive currency translation effects
of €. billion due mainly to the US$. Within total assets of
€. billion, total assets related to SFS increased to €.
billion as of September , from €. billion a year ear-
lier, driven by the growth strategy at SFS. These amounts re-
presented % of Siemens’ total assets in fiscal , compared
to % in the prior year. Total current assets were % in fiscal
, compared to % in the prior year.
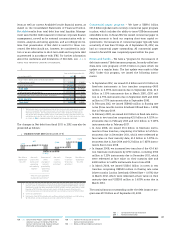
The following table shows current assets at the respective
balance sheet dates:
(in millions of €)
Year ended September ,
Cash and cash equivalents 10,891 12,468
Available-for-sale financial assets 524 477
Trade and other receivables 15,220 14,847
Other current financial assets 2,901 2,628
Inventories 15,679 15,143
Income tax receivables 836 798
Other current assets 1,277 1,264
Assets classified as held for disposal 4,800 4,917
Total current assets 52,129 52,542
Cash and cash equivalents totaled €. billion as of Septem-
ber , . The decrease of €. billion from the prior-year
level was mainly due to net cash provided by operating activi-
ties of €. billion, more than offset by net cash used in in-
vesting activities of €. billion and net cash used in financ-
ing activities of €. billion in fiscal . For detailed infor-
mation, see .. .
The growth strategy at SFS was the primary factor in the in-
crease year-over-year of € million in the line item Trade and
other receivables and the increase of € million in the line
item Other current financial assets.
The increase of € million year-over-year in the line item
Inventories was due primarily to higher inventories in Total
Sectors. This factor was most notable in the Energy Sector driv-
en by higher finished goods and products held for resale and in
the Infrastructure & Cities Sector driven by an increase in costs
and earnings in excess of billings on uncompleted contracts.
Assets classified as held for disposal decreased to €. bil-
lion as of September , compared to €. billion a year
earlier. The decline year-over-year was due primarily to lower
assets at OSRAM and the sale of our % interest in OAO Power
Machines partly offset by an increase in assets relating to the
solar business, which was classified as discontinued opera-
tions during the fourth quarter of fiscal .
Long-term assets at the respective balance sheet dates were as
follows:
(in millions of €)
Year ended September ,
Goodwill 17,069 15,706
Other intangible assets 4,595 4,444
Property, plant and equipment 10,763 10,477
Investments accounted for using
the equity method 4,436 4,966
Other financial assets 14,666 12,126
Deferred tax assets 3,777 3,206
Other assets 846 776
Total long-term assets 56,153 51,701
Goodwill increased to €. billion as of September ,
compared to €. billion a year earlier. The increase in
goodwill was due mainly to acquisitions and purchase ac-
counting adjustments and to a lesser extent to currency trans-
lation differences. Acquisitions and purchase accounting ad-
justments included the acquisition of the Connectors and
Measurements Division of Expro Holdings UK Ltd in the
Energy Sector, RuggedCom Inc. in the Industry Sector, the
NEM B.V. business in the Energy Sector and eMeter Corpora-
tion in the Infrastructure & Cities Sector.
For information on additions to other intangible assets and
property, plant and equipment see ..
.
Investments accounted for using the equity method decreased
year-over-year by € million. The main factor was a sharply
higher equity investment loss related to our share in NSN year-
over-year.
The line item Other financial assets increased to €. bil-
lion as of September , compared to €. billion a
year earlier. The change was due primarily to higher loan re-
ceivables driven by the growth strategy at SFS, an increase in
the non-current portion of the fair market values of financial
derivatives used for our hedging activities and an increase in
the market value of our shares in AtoS.
.