Siemens 2012 Annual Report Download - page 269
Download and view the complete annual report
Please find page 269 of the 2012 Siemens annual report below. You can navigate through the pages in the report by either clicking on the pages listed below, or by using the keyword search tool below to find specific information within the annual report.-
 1
1 -
2
-
3
-
4
-
5
-
6
-
7
-
8
-
9
-
10
-
11
-
12
-
13
-
14
-
15
-
16
-
17
-
18
-
19
-
20
-
21
-
22
-
23
-
24
-
25
-
26
-
27
-
28
-
29
-
30
-
31
-
32
-
33
-
34
-
35
-
36
-
37
-
38
-
39
-
40
-
41
-
42
-
43
-
44
-
45
-
46
-
47
-
48
-
49
-
50
-
51
-
52
-
53
-
54
-
55
-
56
-
57
-
58
-
59
-
60
-
61
-
62
-
63
-
64
-
65
-
66
-
67
-
68
-
69
-
70
-
71
-
72
-
73
-
74
-
75
-
76
-
77
-
78
-
79
-
80
-
81
-
82
-
83
-
84
-
85
-
86
-
87
-
88
-
89
-
90
-
91
-
92
-
93
-
94
-
95
-
96
-
97
-
98
-
99
-
100
-
101
-
102
-
103
-
104
-
105
-
106
-
107
-
108
-
109
-
110
-
111
-
112
-
113
-
114
-
115
-
116
-
117
-
118
-
119
-
120
-
121
-
122
-
123
-
124
-
125
-
126
-
127
-
128
-
129
-
130
-
131
-
132
-
133
-
134
-
135
-
136
-
137
-
138
-
139
-
140
-
141
-
142
-
143
-
144
-
145
-
146
-
147
-
148
-
149
-
150
-
151
-
152
-
153
-
154
-
155
-
156
-
157
-
158
-
159
-
160
-
161
-
162
-
163
-
164
-
165
-
166
-
167
-
168
-
169
-
170
-
171
-
172
-
173
-
174
-
175
-
176
-
177
-
178
-
179
-
180
-
181
-
182
-
183
-
184
-
185
-
186
-
187
-
188
-
189
-
190
-
191
-
192
-
193
-
194
-
195
-
196
-
197
-
198
-
199
-
200
-
201
-
202
-
203
-
204
-
205
-
206
-
207
-
208
-
209
-
210
-
211
-
212
-
213
-
214
-
215
-
216
-
217
-
218
-
219
-
220
-
221
-
222
-
223
-
224
-
225
-
226
-
227
-
228
-
229
-
230
-
231
-
232
-
233
-
234
-
235
-
236
-
237
-
238
-
239
-
240
-
241
-
242
-
243
-
244
-
245
-
246
-
247
-
248
-
249
-
250
-
251
-
252
-
253
-
254
-
255
-
256
-
257
-
258
-
 259
259 -
 260
260 -
 261
261 -
 262
262 -
 263
263 -
 264
264 -
 265
265 -
 266
266 -
 267
267 -
 268
268 -
 269
269 -
 270
270 -
 271
271 -
 272
272 -
 273
273 -
 274
274 -
 275
275 -
 276
276 -
 277
277 -
 278
278 -
 279
279 -
280
-
281
-
282
-
283
-
284
-
285
-
286
-
287
-
288
-
289
-
290
-
291
-
292
-
293
-
294
-
295
-
296
-
297
-
298
-
299
-
300
-
301
-
302
-
303
-
304
-
305
-
306
-
307
-
308
-
309
-
310
-
311
-
312
-
313
-
314
-
315
-
316
-
317
-
318
-
319
-
320
-
321
-
322
-
323
-
324
-
325
-
326
-
327
-
328
-
329
-
330
-
331
-
332
-
333
-
334
-
335
-
336
-
337
-
338
-
339
-
340
-
341
-
342
-
343
-
344
 |
 |

135 D. Consolidated Financial Statements 239 E. Additional Information
140 D. Consolidated Statements of Changes in Equity
142 D. Notes to Consolidated Financial Statements
232 D. Supervisory Board and Managing Board
136 D. Consolidated Statements of Income
137 D. Consolidated Statements of Comprehensive Income
138 D. Consolidated Statements of Financial Position
139 D. Consolidated Statements of Cash Flow
The assumptions used for the calculation of the DBO as of the
period-end of the preceding fiscal year are used to determine
the calculation of interest cost and service cost of the follow-
ing year. The total expected return for the fiscal year will be
based on the expected rates of return for the respective year
multiplied by the fair value of plan assets at the preceding fis-
cal years period-end date. The fair value and thus the expected
return on plan assets are adjusted for significant events after
the fiscal year end, such as a supplemental funding.
The discount rate assumptions reflect the rates available on
high-quality corporate bonds or government bonds of consis-
tent duration and currency at the period-end date. The expect-
ed return on plan assets is determined on a uniform basis, con-
sidering long-term historical returns, asset allocation, and fu-
ture estimates of long-term investment returns. In fiscal
and fiscal , the expected return on plan assets remained
primarily unchanged. Changes of the mortality assumption,
primarily in Switzerland, increased the DBO by .%. Changes
of other actuarial assumptions not mentioned above, such as
employee turnover, disability, etc., had an only minor effect on
the overall DBO as of September , .
Experience adjustments, which result from differences be-
tween the actuarial assumptions and the actual occurrence,
increased the DBO by .% in fiscal , decreased the DBO by
.% in fiscal , did not affect the DBO in fiscal , de-
creased the DBO by .% in fiscal and increased the DBO
by .% in fiscal .
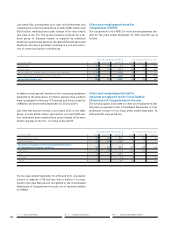
Pension benefits: sensitivity analysis
A one-percentage-point change of the established assumptions
mentioned above, used for the calculation of the NPBC for fiscal
, or a change in the fair value of plan assets of € mil-
lion, as of September , , respectively, would result in the
following increase (decrease) of the fiscal NPBC:
Effect on NPBC
due to a one-percentage-
point / €
(in millions of €) increase decrease
Discount rate 80 (111)
Expected return on plan assets (236) 236
Rate of compensation increase 22 (19)
Rate of pension progression 139 (104)
Fair value of plan assets (32) 32
Increases and decreases in the discount rate, rate of compen-
sation increase and rate of pension progression which are
used in determining the DBO do not have a symmetrical effect
on NPBC primarily due to the compound interest effect created
when determining the net present value of the future pension
benefit. If more than one of the assumptions were changed si-
multaneously, the cumulative impact would not necessarily be
the same as if only one assumption was changed in isolation.
Pension benefits: plan assets
The asset allocation of the plan assets of the pension benefit
plans as of the period-end date in fiscal and , as well
as the target asset allocation for fiscal year , are as follows:
Target asset allocation Asset allocation
September , September , September ,
Asset class Total Domestic Foreign Total Domestic Foreign
Equity 20 – 50% 27% 27% 27% 28% 29% 27%
Fixed income 40 – 70% 62% 64% 60% 62% 63% 62%
Real estate 5 – 15% 7% 6% 7% 7% 6% 8%
Cash and other assets 0 – 15% 4% 3% 6% 3% 2% 3%
100% 100% 100% 100% 100% 100%
Derivatives are reported under the asset class whose risk is
hedged. Current asset allocation is composed of high quality
government and selected corporate bonds. Siemens constant-
ly reviews the asset allocation in light of the duration of its
pension liabilities and analyzes trends and events that may af-
fect asset values in order to initiate appropriate measures at a
very early stage.
The plan assets include own shares and debt instruments of
the Company with a fair value of € million and € million as
of September , and .