Siemens 2012 Annual Report Download - page 169
Download and view the complete annual report
Please find page 169 of the 2012 Siemens annual report below. You can navigate through the pages in the report by either clicking on the pages listed below, or by using the keyword search tool below to find specific information within the annual report.-
 1
1 -
2
-
3
-
4
-
5
-
6
-
7
-
8
-
9
-
10
-
11
-
12
-
13
-
14
-
15
-
16
-
17
-
18
-
19
-
20
-
21
-
22
-
23
-
24
-
25
-
26
-
27
-
28
-
29
-
30
-
31
-
32
-
33
-
34
-
35
-
36
-
37
-
38
-
39
-
40
-
41
-
42
-
43
-
44
-
45
-
46
-
47
-
48
-
49
-
50
-
51
-
52
-
53
-
54
-
55
-
56
-
57
-
58
-
59
-
60
-
61
-
62
-
63
-
64
-
65
-
66
-
67
-
68
-
69
-
70
-
71
-
72
-
73
-
74
-
75
-
76
-
77
-
78
-
79
-
80
-
81
-
82
-
83
-
84
-
85
-
86
-
87
-
88
-
89
-
90
-
91
-
92
-
93
-
94
-
95
-
96
-
97
-
98
-
99
-
100
-
101
-
102
-
103
-
104
-
105
-
106
-
107
-
108
-
109
-
110
-
111
-
112
-
113
-
114
-
115
-
116
-
117
-
118
-
119
-
120
-
121
-
122
-
123
-
124
-
125
-
126
-
127
-
128
-
129
-
130
-
131
-
132
-
133
-
134
-
135
-
136
-
137
-
138
-
139
-
140
-
141
-
142
-
143
-
144
-
145
-
146
-
147
-
148
-
149
-
150
-
151
-
152
-
153
-
154
-
155
-
156
-
157
-
158
-
 159
159 -
 160
160 -
 161
161 -
 162
162 -
 163
163 -
 164
164 -
 165
165 -
 166
166 -
 167
167 -
 168
168 -
 169
169 -
 170
170 -
 171
171 -
 172
172 -
 173
173 -
 174
174 -
 175
175 -
 176
176 -
 177
177 -
 178
178 -
 179
179 -
180
-
181
-
182
-
183
-
184
-
185
-
186
-
187
-
188
-
189
-
190
-
191
-
192
-
193
-
194
-
195
-
196
-
197
-
198
-
199
-
200
-
201
-
202
-
203
-
204
-
205
-
206
-
207
-
208
-
209
-
210
-
211
-
212
-
213
-
214
-
215
-
216
-
217
-
218
-
219
-
220
-
221
-
222
-
223
-
224
-
225
-
226
-
227
-
228
-
229
-
230
-
231
-
232
-
233
-
234
-
235
-
236
-
237
-
238
-
239
-
240
-
241
-
242
-
243
-
244
-
245
-
246
-
247
-
248
-
249
-
250
-
251
-
252
-
253
-
254
-
255
-
256
-
257
-
258
-
259
-
260
-
261
-
262
-
263
-
264
-
265
-
266
-
267
-
268
-
269
-
270
-
271
-
272
-
273
-
274
-
275
-
276
-
277
-
278
-
279
-
280
-
281
-
282
-
283
-
284
-
285
-
286
-
287
-
288
-
289
-
290
-
291
-
292
-
293
-
294
-
295
-
296
-
297
-
298
-
299
-
300
-
301
-
302
-
303
-
304
-
305
-
306
-
307
-
308
-
309
-
310
-
311
-
312
-
313
-
314
-
315
-
316
-
317
-
318
-
319
-
320
-
321
-
322
-
323
-
324
-
325
-
326
-
327
-
328
-
329
-
330
-
331
-
332
-
333
-
334
-
335
-
336
-
337
-
338
-
339
-
340
-
341
-
342
-
343
-
344
 |
 |

135 D. Consolidated Financial Statements
239 E. Additional Information
130 C. Siemens AG (Discussion on basis of
German Commercial Code)
134 C. Notes and forward-looking statements
129 C. Compensation Report, Corporate Governance
statement pursuant to Section a of the
German Commercial Code, Takeover-relevant
information and explanatory report
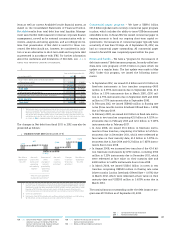
partly offset by higher credit hits. The growth strategy at SFS
has led to a significant build-up in total assets, from €. bil-
lion at the end of fiscal to €. billion at the end of
fiscal , including positive currency translation effects.
The following table provides further information on the capital
structure of SFS as of September , and :
(in millions of €)
Year ended September ,
Allocated equity 1,790 1,593
Total debt 14,558 12,075
therein intragroup financing 14,510 12,066
therein debt from external sources 47 9
Debt to equity ratio 8.13 7.58
Cash and cash equivalents 116 178
Both Moody ’s and Standard & Poor’s view SFS as a captive
finance company. These rating agencies generally recognize
and accept higher levels of debt attributable to captive finance
subsidiaries in determining long-term and short-term credit
ratings.
The allocated equity for SFS is mainly determined and influ-
enced by the size and quality of its portfolio of commercial
finance as well as project and structured finance assets (pri-
marily loans and leases) and equity investments. This alloca-
tion is designed to cover the risks of the underlying business
and is in line with common risk management standards. The
actual risk of the SFS portfolio is evaluated and controlled on a
regular basis. The allocated equity is calculated quarterly.
...
Reconciliation to Consolidated Financial Statements includes
Centrally managed portfolio activities, Siemens Real Estate
(SRE) and various categories of items which are not allocated
to the Sectors and to SFS because the Company ’s management
has determined that such items are not indicative of the Sectors’
and SFS’ respective performance.
Centrally managed portfolio activities
Centrally managed portfolio activities reported a loss of €
million in fiscal , compared to a loss of € million in fiscal
.
Siemens Real Estate
Income before income taxes at SRE was € million in fiscal
, compared to € million in fiscal . This decrease is
due in part to lower income related to the disposal of real es-
tate. SRE expects to continue with real estate disposals de-
pending on market conditions.
Corporate items and pensions
Corporate items and pensions totaled a negative € million
in fiscal compared to a negative € million a year earlier.
The difference was due mainly to centrally carried pension ex-
pense, which totaled a negative € million in fiscal , com-
pared to a positive € million in the prior year. The change is
due primarily to a negative effect resulting from a lower ex-
pected return on plan assets and higher interest costs.
Corporate items were a negative € million in fiscal
compared to a negative € million in fiscal . The amount
for fiscal benefited from positive effects related to legal
and regulatory matters, compared to net expenses, including a
provision of regional risks of € million, related to such mat-
ters in the prior year. In addition, fiscal includes an
amount of € million related to reimbursements to AtoS,
compared to € million in the prior year. It also includes a net
gain of € million related to a major asset retirement obliga-
tion, compared to a net loss of € million in fiscal . The
prior year benefited from management’s allocation of €
million of personnel-related costs related to special employee
remuneration, which had been accrued in Corporate items in
fiscal . Within this amount, € million was allocated to
the Sectors.
Eliminations, Corporate Treasury
and other reconciling items
In fiscal , income before income taxes from Eliminations,
Corporate Treasury and other reconciling items was a positive
€ million, compared to a negative € million a year earlier.
The main factor of the improvement was Corporate Treasury
activities, due mainly to positive changes in the fair market
value of interest rate derivatives not qualifying for hedge
accounting used for interest rate management, partly offset
by negative currency effects relating to corporate financing
activities.