Target 2011 Annual Report Download - page 2
Download and view the complete annual report
Please find page 2 of the 2011 Target annual report below. You can navigate through the pages in the report by either clicking on the pages listed below, or by using the keyword search tool below to find specific information within the annual report.-
 1
1 -
 2
2 -
 3
3 -
 4
4 -
 5
5 -
 6
6 -
 7
7 -
 8
8 -
 9
9 -
 10
10 -
 11
11 -
 12
12 -
 13
13 -
14
-
15
-
16
-
17
-
18
-
19
-
20
-
21
-
22
-
23
-
24
-
25
-
26
-
27
-
28
-
29
-
30
-
31
-
32
-
33
-
34
-
35
-
36
-
37
-
38
-
39
-
40
-
41
-
42
-
43
-
44
-
45
-
46
-
47
-
48
-
49
-
50
-
51
-
52
-
53
-
54
-
55
-
56
-
57
-
58
-
59
-
60
-
61
-
62
-
63
-
64
-
65
-
66
-
67
-
68
-
69
-
70
-
71
-
72
-
73
-
74
-
75
-
76
-
77
-
78
-
79
-
80
-
81
-
82
-
83
-
84
-
85
-
86
-
87
-
88
-
89
-
90
-
91
-
92
-
93
-
94
-
95
-
96
-
97
-
98
-
99
-
100
 |
 |
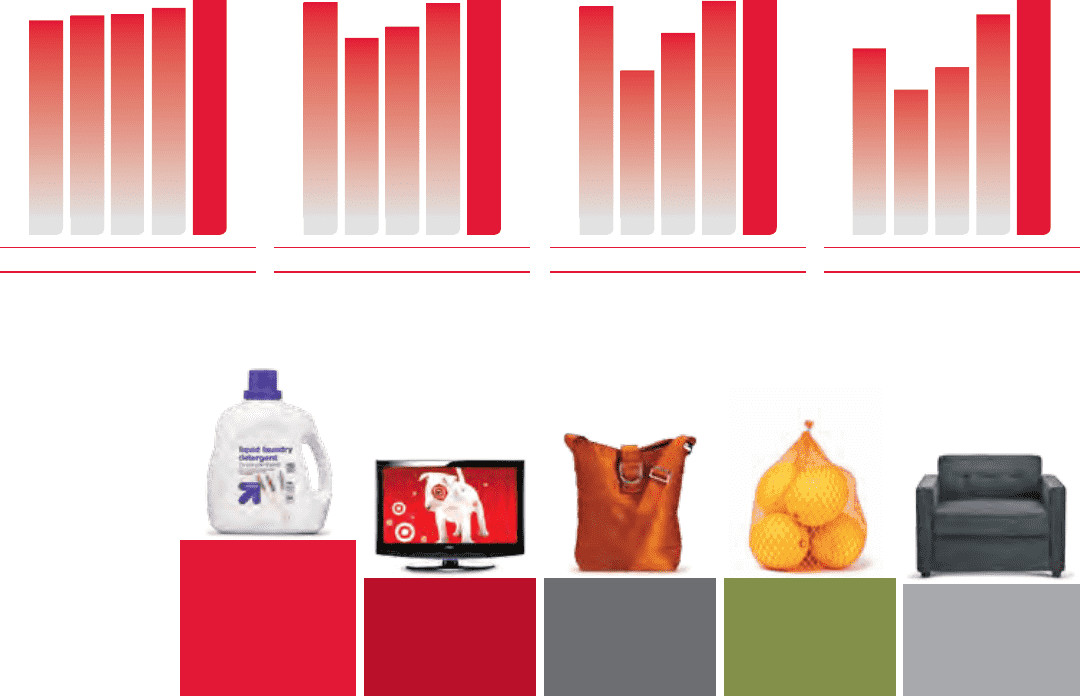
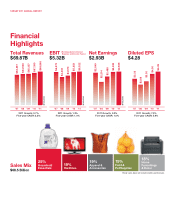
19%
Food &
Pet Supplies
Financial
Highlights
TARGET 2011 ANNUAL REPORT
Retail sales, does not include credit card revenues.
25%
Household
Essentials 19%
Hardlines
19%
Apparel &
Accessories
18%
Home
Furnishings
& Décor
Sales Mix
$68.5 Billion
$2,849
$2,214
$2,488
$2,929
$2,920
2011 Growth: 0.3%
Five-year CAGR: 1.0%
IN MILLIONS
’11’10’09’08’07
$3.33
$2.86
$3.30
$4.28
$4.00
2011 Growth: 7.0%
Five-year CAGR: 5.9%
’11’10’09’08’07
$5,272
$4,402
$4,673
$5,322
$5,252
2011 Growth: 1.3%
Five-year CAGR: 1.0%
IN MILLIONS
’11’10’09’08’07
$63,367
$64,948
$65,357
$69,865
$67,39 0
2011 Growth: 3.7%
Five-year CAGR: 3.3%
IN MILLIONS
’11’10’09’08’07
EBIT
$5.32B
Total Revenues
$69.87B
Diluted EPS
$4.28
Net Earnings
$2.93B
( Earnings before Interest
Expense and Income Taxes)