Target 2011 Annual Report Download - page 79
Download and view the complete annual report
Please find page 79 of the 2011 Target annual report below. You can navigate through the pages in the report by either clicking on the pages listed below, or by using the keyword search tool below to find specific information within the annual report.-
 1
1 -
2
-
3
-
4
-
5
-
6
-
7
-
8
-
9
-
10
-
11
-
12
-
13
-
14
-
15
-
16
-
17
-
18
-
19
-
20
-
21
-
22
-
23
-
24
-
25
-
26
-
27
-
28
-
29
-
30
-
31
-
32
-
33
-
34
-
35
-
36
-
37
-
38
-
39
-
40
-
41
-
42
-
43
-
44
-
45
-
46
-
47
-
48
-
49
-
50
-
51
-
52
-
53
-
54
-
55
-
56
-
57
-
58
-
59
-
60
-
61
-
62
-
63
-
64
-
65
-
66
-
67
-
68
-
 69
69 -
 70
70 -
 71
71 -
 72
72 -
 73
73 -
 74
74 -
 75
75 -
 76
76 -
 77
77 -
 78
78 -
 79
79 -
 80
80 -
 81
81 -
 82
82 -
 83
83 -
 84
84 -
 85
85 -
 86
86 -
 87
87 -
 88
88 -
 89
89 -
90
-
91
-
92
-
93
-
94
-
95
-
96
-
97
-
98
-
99
-
100
 |
 |

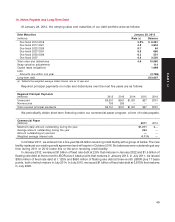
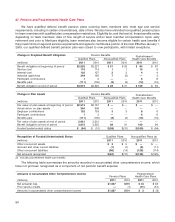
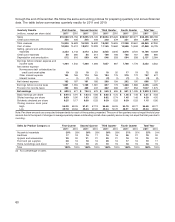
The following table summarizes the changes in accumulated other comprehensive income for the years ended
January 28, 2012 and January 29, 2011, related to our pension and postretirement health care plans:
PostretirementChange in Accumulated Other Comprehensive Income
Pension Benefits Health Care Benefits
(millions) Pretax Net of tax Pretax Net of tax
January 30, 2010 $ 895 $544 $(12) $(7)
Net actuarial loss 40 25 3 2
Amortization of net actuarial losses (44) (27) (4) (3)
Amortization of prior service costs and transition 3 1 10 6
January 29, 2011 $ 894 $543 $ (3) $(2)
Net actuarial loss 198 120 — —
Amortization of net actuarial losses (67) (41) (4) (2)
Amortization of prior service costs and transition 2 1 10 6
January 28, 2012 $1,027 $623 $ 3 $ 2
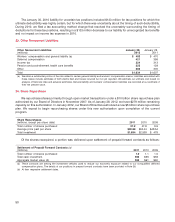
The following table summarizes the amounts in accumulated other comprehensive income expected to be
amortized and recognized as a component of net periodic benefit expense in 2012:
Expected Amortization of Amounts in Accumulated Other Comprehensive Income
(millions) Pretax Net of tax
Net actuarial loss $106 $64
Prior service credits (10) (6)
Total amortization expense $96 $58
The following table summarizes our net pension and postretirement health care benefits expense for the years
2011, 2010 and 2009:
PostretirementNet Pension and Postretirement Health Care Benefits Expense
Pension Benefits Health Care Benefits
(millions) 2011 2010 2009 2011 2010 2009
Service cost of benefits earned during the period $ 117 $ 115 $ 100 $10 $9$7
Interest cost on projected benefit obligation 137 129 125 446
Expected return on assets (206) (191) (177) ———
Amortization of losses 67 44 24 442
Amortization of prior service cost (2) (3) (2) (10) (10) (2)
Total $ 113 $94 $70 $8$7$13
Prior service cost amortization is determined using the straight-line method over the average remaining service
period of team members expected to receive benefits under the plan.
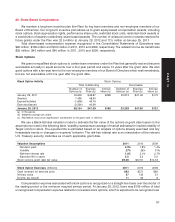
Defined Benefit Pension Plan Information
(millions) 2011 2010
Accumulated benefit obligation (ABO) for all plans (a) $2,872 $2,395
Projected benefit obligation for pension plans with an ABO in excess of plan assets (b) 55 47
Total ABO for pension plans with an ABO in excess of plan assets 48 42
(a) The present value of benefits earned to date assuming no future salary growth.
(b) The present value of benefits earned to date by plan participants, including the effect of assumed future salary increases.
55
PART II