Target 2011 Annual Report Download - page 74
Download and view the complete annual report
Please find page 74 of the 2011 Target annual report below. You can navigate through the pages in the report by either clicking on the pages listed below, or by using the keyword search tool below to find specific information within the annual report.-
 1
1 -
2
-
3
-
4
-
5
-
6
-
7
-
8
-
9
-
10
-
11
-
12
-
13
-
14
-
15
-
16
-
17
-
18
-
19
-
20
-
21
-
22
-
23
-
24
-
25
-
26
-
27
-
28
-
29
-
30
-
31
-
32
-
33
-
34
-
35
-
36
-
37
-
38
-
39
-
40
-
41
-
42
-
43
-
44
-
45
-
46
-
47
-
48
-
49
-
50
-
51
-
52
-
53
-
54
-
55
-
56
-
57
-
58
-
59
-
60
-
61
-
62
-
63
-
 64
64 -
 65
65 -
 66
66 -
 67
67 -
 68
68 -
 69
69 -
 70
70 -
 71
71 -
 72
72 -
 73
73 -
 74
74 -
 75
75 -
 76
76 -
 77
77 -
 78
78 -
 79
79 -
 80
80 -
 81
81 -
 82
82 -
 83
83 -
 84
84 -
85
-
86
-
87
-
88
-
89
-
90
-
91
-
92
-
93
-
94
-
95
-
96
-
97
-
98
-
99
-
100
 |
 |

The January 30, 2010 liability for uncertain tax positions included $133 million for tax positions for which the
ultimate deductibility was highly certain, but for which there was uncertainty about the timing of such deductibility.
During 2010, we filed a tax accounting method change that resolved the uncertainty surrounding the timing of
deductions for these tax positions, resulting in a $133 million decrease to our liability for unrecognized tax benefits
and no impact on income tax expense in 2010.
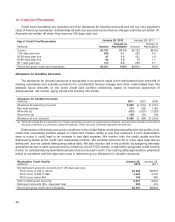
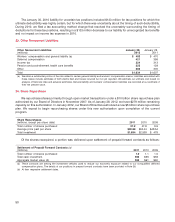
23. Other Noncurrent Liabilities
Other Noncurrent Liabilities January 28, January 29,
(millions) 2012 2011
Workers’ compensation and general liability (a) $ 482 $ 470
Deferred compensation 421 396
Income tax 224 313
Pension and postretirement health care benefits 225 128
Other 282 300
Total $1,634 $1,607
(a) We retain a substantial portion of the risk related to certain general liability and workers’ compensation claims. Liabilities associated with
these losses include estimates of both claims filed and losses incurred but not yet reported. We estimate our ultimate cost based on
analysis of historical data and actuarial estimates. General liability and workers’ compensation liabilities are recorded at our estimate of
their net present value.
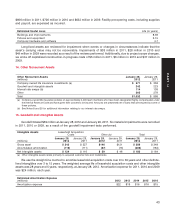
24. Share Repurchase
We repurchase shares primarily through open market transactions under a $10 billion share repurchase plan
authorized by our Board of Directors in November 2007. As of January 28, 2012, we have $279 million remaining
capacity on this authorization. In January 2012, our Board of Directors authorized a new $5 billion share repurchase
plan. We expect to begin repurchasing shares under this new authorization upon completion of the current
program.
Share Repurchases
(millions, except per share data) 2011 2010 2009
Total number of shares purchased 37.2 47.8 9.9
Average price paid per share $50.89 $52.44 $48.54
Total investment $1,894 $2,508 $ 479
Of the shares reacquired, a portion was delivered upon settlement of prepaid forward contracts as follows:
Settlement of Prepaid Forward Contracts (a)
(millions) 2011 2010 2009
Total number of shares purchased 1.0 1.1 1.5
Total cash investment $52 $56 $56
Aggregate market value (b) $52 $61 $60
(a) These contracts are among the investment vehicles used to reduce our economic exposure related to our nonqualified deferred
compensation plans. The details of our positions in prepaid forward contracts have been provided in Note 26.
(b) At their respective settlement dates.
50