Target 2011 Annual Report Download - page 84
Download and view the complete annual report
Please find page 84 of the 2011 Target annual report below. You can navigate through the pages in the report by either clicking on the pages listed below, or by using the keyword search tool below to find specific information within the annual report.-
 1
1 -
2
-
3
-
4
-
5
-
6
-
7
-
8
-
9
-
10
-
11
-
12
-
13
-
14
-
15
-
16
-
17
-
18
-
19
-
20
-
21
-
22
-
23
-
24
-
25
-
26
-
27
-
28
-
29
-
30
-
31
-
32
-
33
-
34
-
35
-
36
-
37
-
38
-
39
-
40
-
41
-
42
-
43
-
44
-
45
-
46
-
47
-
48
-
49
-
50
-
51
-
52
-
53
-
54
-
55
-
56
-
57
-
58
-
59
-
60
-
61
-
62
-
63
-
64
-
65
-
66
-
67
-
68
-
69
-
70
-
71
-
72
-
73
-
 74
74 -
 75
75 -
 76
76 -
 77
77 -
 78
78 -
 79
79 -
 80
80 -
 81
81 -
 82
82 -
 83
83 -
 84
84 -
 85
85 -
 86
86 -
 87
87 -
 88
88 -
 89
89 -
 90
90 -
 91
91 -
 92
92 -
 93
93 -
 94
94 -
95
-
96
-
97
-
98
-
99
-
100
 |
 |

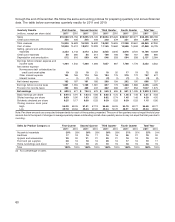
through the end of December. We follow the same accounting policies for preparing quarterly and annual financial
data. The table below summarizes quarterly results for 2011 and 2010:
First Quarter Second Quarter Third Quarter Fourth Quarter Total YearQuarterly Results
(millions, except per share data) 2011 2010 2011 2010 2011 2010 2011 2010 2011 2010
Sales $15,580 $15,158 $15,895 $15,126 $16,054 $15,226 $20,937 $20,277 $68,466 $65,786
Credit card revenues 355 435 345 406 348 379 351 384 1,399 1,604
Total revenues 15,935 15,593 16,240 15,532 16,402 15,605 21,288 20,661 69,865 67,390
Cost of sales 10,838 10,412 10,872 10,293 11,165 10,562 14,986 14,458 47,860 45,725
Selling, general and administrative
expenses 3,233 3,143 3,473 3,263 3,525 3,345 3,876 3,720 14,106 13,469
Credit card expenses 88 280 86 214 109 198 162 167 446 860
Depreciation and amortization 512 516 509 496 546 533 564 538 2,131 2,084
Earnings before interest expense and
income taxes 1,264 1,242 1,300 1,266 1,057 967 1,700 1,778 5,322 5,252
Net interest expense
Nonrecourse debt collateralized by
credit card receivables 19 23 18 21 18 20 17 19 72 83
Other interest expense 164 165 174 165 184 175 276 172 797 677
Interest income —(1) (1) (1) (2) (1) (1) (1) (3) (3)
Net interest expense 183 187 191 185 200 194 292 190 866 757
Earnings before income taxes 1,081 1,055 1,109 1,081 857 773 1,408 1,588 4,456 4,495
Provision for income taxes 392 384 405 402 302 238 427 553 1,527 1,575
Net earnings $ 689 $ 671 $ 704 $ 679 $ 555 $ 535 $ 981 $ 1,035 $ 2,929 $ 2,920
Basic earnings per share $ 0.99 $ 0.91 $ 1.03 $ 0.93 $ 0.82 $ 0.75 $ 1.46 $ 1.46 $ 4.31 $ 4.03
Diluted earnings per share 0.99 0.90 1.03 0.92 0.82 0.74 1.45 1.45 4.28 4.00
Dividends declared per share 0.25 0.17 0.30 0.25 0.30 0.25 0.30 0.25 1.15 0.92
Closing common stock price:
High 55.39 58.05 51.81 57.13 55.56 55.05 54.75 60.77 55.56 60.77
Low 49.10 48.64 46.33 49.00 46.44 50.72 48.51 53.48 46.33 48.64
Note: Per share amounts are computed independently for each of the quarters presented. The sum of the quarters may not equal the total year
amount due to the impact of changes in average quarterly shares outstanding and all other quarterly amounts may not equal the total year due to
rounding.
First Quarter Second Quarter Third Quarter Fourth Quarter Total YearSales by Product Category (a)
2011 2010 2011 2010 2011 2010 2011 2010 2011 2010
Household essentials 26% 26% 26% 26% 26% 26% 21% 20% 25% 24%
Hardlines 17 18 16 17 15 16 26 27 19 20
Apparel and accessories 20 20 21 21 20 21 18 18 19 20
Food and pet supplies 20 18 18 16 20 18 17 16 19 17
Home furnishings and d´
ecor 17 18 19 20 19 19 18 19 18 19
Total 100% 100% 100% 100% 100% 100% 100% 100% 100% 100%
(a) As a percentage of sales.
60