Target 2011 Annual Report Download - page 80
Download and view the complete annual report
Please find page 80 of the 2011 Target annual report below. You can navigate through the pages in the report by either clicking on the pages listed below, or by using the keyword search tool below to find specific information within the annual report.-
 1
1 -
2
-
3
-
4
-
5
-
6
-
7
-
8
-
9
-
10
-
11
-
12
-
13
-
14
-
15
-
16
-
17
-
18
-
19
-
20
-
21
-
22
-
23
-
24
-
25
-
26
-
27
-
28
-
29
-
30
-
31
-
32
-
33
-
34
-
35
-
36
-
37
-
38
-
39
-
40
-
41
-
42
-
43
-
44
-
45
-
46
-
47
-
48
-
49
-
50
-
51
-
52
-
53
-
54
-
55
-
56
-
57
-
58
-
59
-
60
-
61
-
62
-
63
-
64
-
65
-
66
-
67
-
68
-
69
-
 70
70 -
 71
71 -
 72
72 -
 73
73 -
 74
74 -
 75
75 -
 76
76 -
 77
77 -
 78
78 -
 79
79 -
 80
80 -
 81
81 -
 82
82 -
 83
83 -
 84
84 -
 85
85 -
 86
86 -
 87
87 -
 88
88 -
 89
89 -
 90
90 -
91
-
92
-
93
-
94
-
95
-
96
-
97
-
98
-
99
-
100
 |
 |

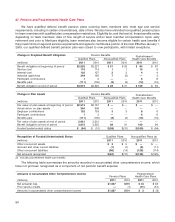
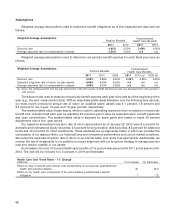
Assumptions
Weighted average assumptions used to determine benefit obligations as of the measurement date were as
follows:
Weighted Average Assumptions Postretirement
Pension Benefits Health Care Benefits
2011 2010 2011 2010
Discount rate 4.65% 5.50% 3.60% 4.35%
Average assumed rate of compensation increase 3.50% 4.00% n/a n/a
Weighted average assumptions used to determine net periodic benefit expense for each fiscal year were as
follows:
Weighted Average Assumptions Postretirement
Pension Benefits Health Care Benefits
2011 2010 2009 2011 2010 (a) 2009 (a)
Discount rate 5.50% 5.85% 6.50% 4.35% 4.85% 6.50%
Expected long-term rate of return on plan assets 8.00% 8.00% 8.00% n/a n/a n/a
Average assumed rate of compensation increase 4.00% 4.00% 4.25% n/a n/a n/a
(a) Due to the remeasurement from the plan amendment in the third quarter of 2009, the discount rate was decreased from 6.50 percent to
4.85 percent.
The discount rate used to measure net periodic benefit expense each year is the rate as of the beginning of the
year (e.g., the prior measurement date). With an essentially stable asset allocation over the following time periods,
our most recent compound annual rate of return on qualified plans’ assets was 5.1 percent, 7.8 percent and
8.3 percent for the 5-year, 10-year and 15-year periods, respectively.
The market-related value of plan assets, which is used in calculating expected return on assets in net periodic
benefit cost, is determined each year by adjusting the previous year’s value by expected return, benefit payments
and cash contributions. The market-related value is adjusted for asset gains and losses in equal 20 percent
adjustments over a five- year period.
Our expected annualized long-term rate of return assumptions as of January 28, 2012 were 8.5 percent for
domestic and international equity securities, 5.5 percent for long-duration debt securities, 8.5 percent for balanced
funds and 10.0 percent for other investments. These estimates are a judgmental matter in which we consider the
composition of our asset portfolio, our historical long-term investment performance and current market conditions.
We review the expected long-term rate of return on an annual basis, and revise it as appropriate. Additionally, we
monitor the mix of investments in our portfolio to ensure alignment with our long-term strategy to manage pension
cost and reduce volatility in our assets.
An increase in the cost of covered health care benefits of 7.5 percent was assumed for 2011 and is assumed for
2012. The rate will be reduced to 5.0 percent in 2019 and thereafter.
Health Care Cost Trend Rates – 1% Change
(millions) 1% Increase 1% Decrease
Effect on total of service and interest cost components of net periodic postretirement
health care benefit expense $1 $(1)
Effect on the health care component of the accumulated postretirement benefit
obligation 7(7)
56