Target 2011 Annual Report Download - page 21
Download and view the complete annual report
Please find page 21 of the 2011 Target annual report below. You can navigate through the pages in the report by either clicking on the pages listed below, or by using the keyword search tool below to find specific information within the annual report.-
 1
1 -
2
-
3
-
4
-
5
-
6
-
7
-
8
-
9
-
10
-
 11
11 -
 12
12 -
 13
13 -
 14
14 -
 15
15 -
 16
16 -
 17
17 -
 18
18 -
 19
19 -
 20
20 -
 21
21 -
 22
22 -
 23
23 -
 24
24 -
 25
25 -
 26
26 -
 27
27 -
 28
28 -
 29
29 -
 30
30 -
 31
31 -
32
-
33
-
34
-
35
-
36
-
37
-
38
-
39
-
40
-
41
-
42
-
43
-
44
-
45
-
46
-
47
-
48
-
49
-
50
-
51
-
52
-
53
-
54
-
55
-
56
-
57
-
58
-
59
-
60
-
61
-
62
-
63
-
64
-
65
-
66
-
67
-
68
-
69
-
70
-
71
-
72
-
73
-
74
-
75
-
76
-
77
-
78
-
79
-
80
-
81
-
82
-
83
-
84
-
85
-
86
-
87
-
88
-
89
-
90
-
91
-
92
-
93
-
94
-
95
-
96
-
97
-
98
-
99
-
100
 |
 |
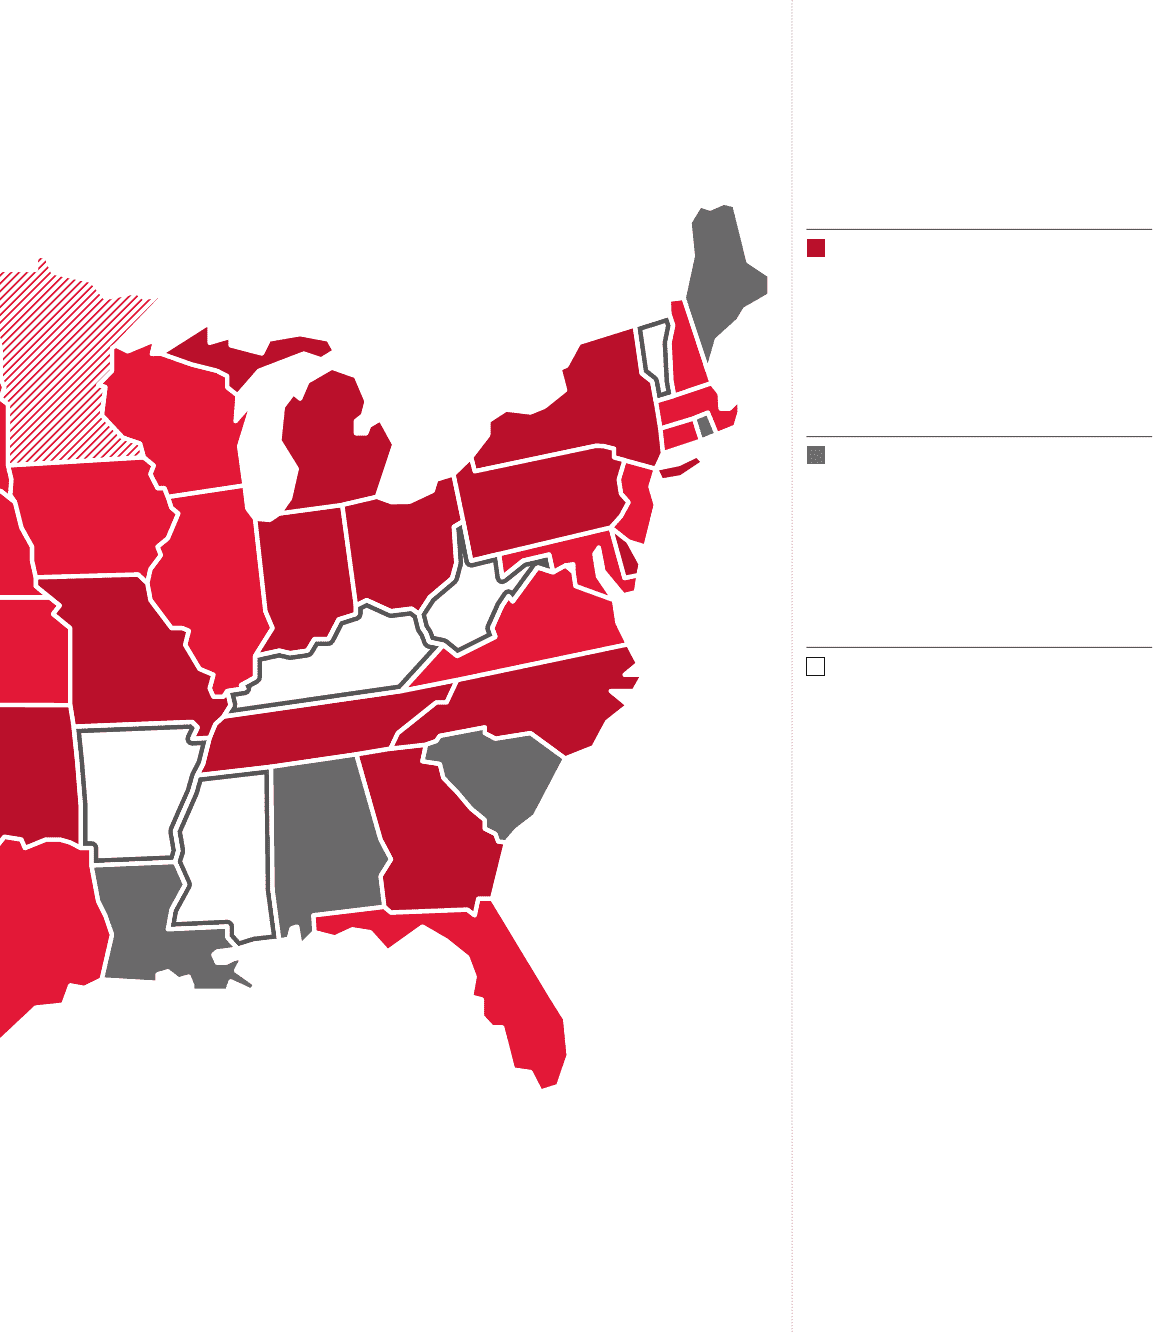
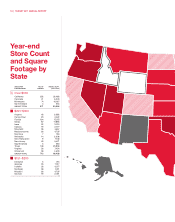
Sales per capita is defined as sales by
state divided by state population.
SALES PER NO. OF RETAIL SQ. FT.
CAPITA GROUP STORES (THOUSANDS)
$151–$200 (continued)
New York 66 8,996
North Carolina 47 6,225
Ohio 64 8,006
Oklahoma 15 2,157
Oregon 18 2,201
Pennsylvania 63 8,238
Tennessee 32 4,096
Utah 12 1,818
Washington 35 4,098
GROUP TOTAL 557 72,369
$101–$150
Alabama 20 2,867
Alaska 3 504
District of Columbia 1 179
Hawaii 4 695
Louisiana 16 2,246
Maine 5 630
New Mexico 9 1,024
Rhode Island 4 517
South Carolina 18 2,224
GROUP TOTAL 80 10,886
$0–$100
Arkansas 9 1,165
Idaho 6 664
Kentucky 14 1,660
Mississippi 6 743
Vermont 0 0
West Virginia 6 755
Wyoming 2 187
GROUP TOTAL 43 5,174
TARGET 2011 ANNUAL REPORT | 19
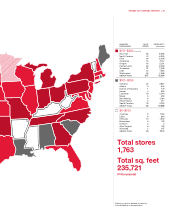
Total stores
1,763
Total sq. feet
235,721
(in thousands)