Target 2011 Annual Report Download - page 83
Download and view the complete annual report
Please find page 83 of the 2011 Target annual report below. You can navigate through the pages in the report by either clicking on the pages listed below, or by using the keyword search tool below to find specific information within the annual report.-
 1
1 -
2
-
3
-
4
-
5
-
6
-
7
-
8
-
9
-
10
-
11
-
12
-
13
-
14
-
15
-
16
-
17
-
18
-
19
-
20
-
21
-
22
-
23
-
24
-
25
-
26
-
27
-
28
-
29
-
30
-
31
-
32
-
33
-
34
-
35
-
36
-
37
-
38
-
39
-
40
-
41
-
42
-
43
-
44
-
45
-
46
-
47
-
48
-
49
-
50
-
51
-
52
-
53
-
54
-
55
-
56
-
57
-
58
-
59
-
60
-
61
-
62
-
63
-
64
-
65
-
66
-
67
-
68
-
69
-
70
-
71
-
72
-
 73
73 -
 74
74 -
 75
75 -
 76
76 -
 77
77 -
 78
78 -
 79
79 -
 80
80 -
 81
81 -
 82
82 -
 83
83 -
 84
84 -
 85
85 -
 86
86 -
 87
87 -
 88
88 -
 89
89 -
 90
90 -
 91
91 -
 92
92 -
 93
93 -
94
-
95
-
96
-
97
-
98
-
99
-
100
 |
 |

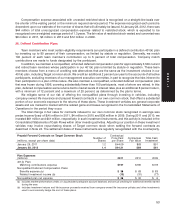
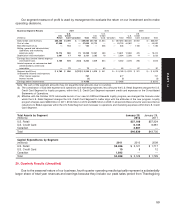
Our segment measure of profit is used by management to evaluate the return on our investment and to make
operating decisions.
2011 2010 2009Business Segment Results
U.S. U.S. U.S.
U.S. Credit U.S. Credit U.S. Credit
(millions) Retail Card Canadian Total Retail Card Canadian Total Retail Card Canadian Total
Sales/Credit card revenues $68,466 $1,399 $ — $69,865 $65,786 $1,604 $— $67,390 $63,435 $1,922 $— $65,357
Cost of sales 47,860 — — 47,860 45,725 — — 45,725 44,062 — — 44,062
Bad debt expense (a) — 154 — 154 — 528 — 528 — 1,185 — 1,185
Selling, general and administrative/
Operations and marketing
expenses (a)(b) 13,774 550 74 14,398 13,367 433 — 13,801 12,989 425 — 13,414
Depreciation and amortization 2,067 17 48 2,131 2,065 19 — 2,084 2,008 14 — 2,023
Earnings/(loss) before interest expense
and income taxes 4,765 678 (122) 5,322 4,629 624 — 5,252 4,376 298 — 4,673
Interest expense on nonrecourse debt
collateralized by credit card
receivables —72 —72—83 —83—97 —97
Segment profit/(loss) $ 4,765 $ 606 $(122) $ 5,250 $ 4,629 $ 541 $— $ 5,169 $ 4,376 $ 201 $— $ 4,576
Unallocated (income) and expenses
Other interest expense 797 677 707
Interest income (3) (3) (3)
Earnings before income taxes $ 4,456 $ 4,495 $ 3,872
Note: The sum of the segment amounts may not equal the total amounts due to rounding.
(a) The combination of bad debt expense and operations and marketing expenses, less amounts the U.S. Retail Segment charges the U.S.
Credit Card Segment for loyalty programs, within the U.S. Credit Card Segment represent credit card expenses on the Consolidated
Statements of Operations.
(b) Effective with the October 2010 nationwide launch of our new 5% REDcard Rewards loyalty program, we changed the formula under
which the U.S. Retail Segment charges the U.S. Credit Card Segment to better align with the attributes of the new program. Loyalty
program charges were $258 million in 2011, $102 million in 2010 and $89 million in 2009. In all periods these amounts were recorded as
reductions to SG&A expenses within the U.S. Retail Segment and increases to operations and marketing expenses within the U.S. Credit
Card Segment.
Total Assets by Segment January 28, January 29,
(millions) 2012 2011
U.S. Retail $37,108 $37,324
U.S. Credit Card 6,135 6,381
Canadian 3,387 —
Total $46,630 $43,705
Capital Expenditures by Segment
(millions) 2011 2010 2009
U.S. Retail $2,466 $ 2,121 $ 1,717
U.S. Credit Card 10 812
Canadian 1,892 ——
Total $4,368 $ 2,129 $ 1,729
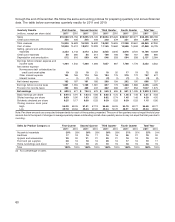
29. Quarterly Results (Unaudited)
Due to the seasonal nature of our business, fourth quarter operating results typically represent a substantially
larger share of total year revenues and earnings because they include our peak sales period from Thanksgiving
59
PART II