Target 2011 Annual Report Download - page 41
Download and view the complete annual report
Please find page 41 of the 2011 Target annual report below. You can navigate through the pages in the report by either clicking on the pages listed below, or by using the keyword search tool below to find specific information within the annual report.-
 1
1 -
2
-
3
-
4
-
5
-
6
-
7
-
8
-
9
-
10
-
11
-
12
-
13
-
14
-
15
-
16
-
17
-
18
-
19
-
20
-
21
-
22
-
23
-
24
-
25
-
26
-
27
-
28
-
29
-
30
-
 31
31 -
 32
32 -
 33
33 -
 34
34 -
 35
35 -
 36
36 -
 37
37 -
 38
38 -
 39
39 -
 40
40 -
 41
41 -
 42
42 -
 43
43 -
 44
44 -
 45
45 -
 46
46 -
 47
47 -
 48
48 -
 49
49 -
 50
50 -
 51
51 -
52
-
53
-
54
-
55
-
56
-
57
-
58
-
59
-
60
-
61
-
62
-
63
-
64
-
65
-
66
-
67
-
68
-
69
-
70
-
71
-
72
-
73
-
74
-
75
-
76
-
77
-
78
-
79
-
80
-
81
-
82
-
83
-
84
-
85
-
86
-
87
-
88
-
89
-
90
-
91
-
92
-
93
-
94
-
95
-
96
-
97
-
98
-
99
-
100
 |
 |

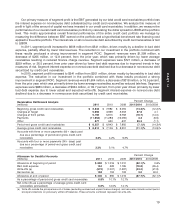
price of retail merchandise. Factors that affect markdowns include inventory management, competitive influences
and economic conditions.
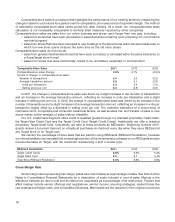
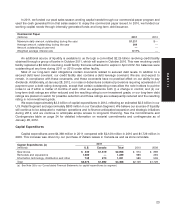
Our gross margin rate was 30.1 percent in 2011, decreasing from 30.5 percent in the prior year, reflecting the
impact of our integrated growth strategies of 5% REDcard Rewards and remodel program, partially offset by
underlying rate improvements within categories. The REDcard Rewards program reduces category gross margin
rates because it drives incremental sales among guests who receive 5% off on virtually all items purchased in our
stores and online. The remodel program reduces the overall gross margin rate because it drives incremental sales
with a stronger-than-average mix in lower-than-average gross margin rate product categories, primarily food.
Our gross margin rate was 30.5 percent in 2010, unchanged from prior year, as margin rates within categories
were generally stable and the impact of sales mix was essentially neutral. There were no other significant variances
in the drivers of gross margin rate.
Selling, General and Administrative Expense Rate
Our selling, general and administrative expense rate represents SG&A expenses as a percentage of sales. See
Note 3 of the Notes to Consolidated Financial Statements for a description of costs included in SG&A expenses.
SG&A expenses exclude depreciation and amortization, as well as expenses associated with our credit card
operations, which are reflected separately in our Consolidated Statements of Operations.
SG&A expense rate was 20.1 percent in 2011 compared with 20.3 percent in 2010 and 20.5 percent in 2009.
The change in the rate in 2011 was primarily due to increased charges to the U.S. Credit Segment and favorable
leverage on store hourly payroll expense. The change in the SG&A expense rate in 2010 was primarily due to
favorable leverage of overall compensation expenses.
Depreciation and Amortization Expense Rate
Our depreciation and amortization expense rate represents depreciation and amortization expense as a
percentage of sales. In 2011, our depreciation and amortization expense rate was 3.0 percent compared with
3.1 percent in 2010 and 3.2 percent in 2009.
Store Data
Number of Stores
Target general Expanded food SuperTarget
merchandise stores assortment stores stores Total
January 29, 2011 1,037 462 251 1,750
Opened — 20 1 21
Format conversion (393) 393 — —
Closed (a) (7) — (1) (8)
January 28, 2012 637 875 251 1,763
Retail Square Feet (b) Target general Expanded food SuperTarget
(thousands) merchandise stores assortment stores stores Total
January 29, 2011 127,292 61,823 44,503 233,618
Opened — 2,802 177 2,979
Format conversion (49,494) 49,594 — 100
Closed (a) (799) — (177) (976)
January 28, 2012 76,999 114,219 44,503 235,721
(a) Includes 5 store relocations in the same trade area and 3 stores closed without replacement.
(b) Reflects total square feet less office, distribution center and vacant space.
17
PART II