Target 2011 Annual Report Download - page 50
Download and view the complete annual report
Please find page 50 of the 2011 Target annual report below. You can navigate through the pages in the report by either clicking on the pages listed below, or by using the keyword search tool below to find specific information within the annual report.-
 1
1 -
2
-
3
-
4
-
5
-
6
-
7
-
8
-
9
-
10
-
11
-
12
-
13
-
14
-
15
-
16
-
17
-
18
-
19
-
20
-
21
-
22
-
23
-
24
-
25
-
26
-
27
-
28
-
29
-
30
-
31
-
32
-
33
-
34
-
35
-
36
-
37
-
38
-
39
-
 40
40 -
 41
41 -
 42
42 -
 43
43 -
 44
44 -
 45
45 -
 46
46 -
 47
47 -
 48
48 -
 49
49 -
 50
50 -
 51
51 -
 52
52 -
 53
53 -
 54
54 -
 55
55 -
 56
56 -
 57
57 -
 58
58 -
 59
59 -
 60
60 -
61
-
62
-
63
-
64
-
65
-
66
-
67
-
68
-
69
-
70
-
71
-
72
-
73
-
74
-
75
-
76
-
77
-
78
-
79
-
80
-
81
-
82
-
83
-
84
-
85
-
86
-
87
-
88
-
89
-
90
-
91
-
92
-
93
-
94
-
95
-
96
-
97
-
98
-
99
-
100
 |
 |
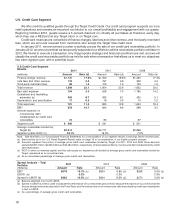
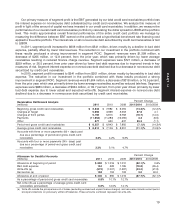
receivables, at January 28, 2012. Credit card receivables and our allowance for doubtful accounts are described in
Note 10 of the Notes to Consolidated Financial Statements.
Long-lived assets Long-lived assets are reviewed for impairment whenever events or changes in circumstances
indicate that the carrying amount of an asset (or asset group) may not be recoverable. An impairment loss would be
recognized when estimated undiscounted future cash flows from the operation and disposition of the asset group
are less than the carrying amount of the asset group. Asset groups have identifiable cash flows independent of
other asset groups. Measurement of an impairment loss would be based on the excess of the carrying amount of
the asset group over its fair value. Fair value is measured using discounted cash flows or independent opinions of
value, as appropriate. A 10 percent decrease in the fair value of assets we intend to sell as of January 28, 2012
would result in additional impairment of $6 million in 2011. Historically, we have not realized material losses upon
sale of long-lived assets.
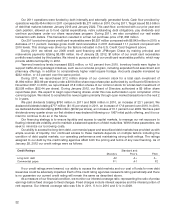
Insurance/self-insurance We retain a substantial portion of the risk related to certain general liability, workers’
compensation, property loss and team member medical and dental claims. However, we maintain stop-loss
coverage to limit the exposure related to certain risks. Liabilities associated with these losses include estimates of
both claims filed and losses incurred but not yet reported. We use actuarial methods which consider a number of
factors to estimate our ultimate cost of losses. General liability and workers’ compensation liabilities are recorded at
our estimate of their net present value; other liabilities referred to above are not discounted. Our workers’
compensation and general liability accrual was $646 million and $628 million at January 28, 2012 and January 29,
2011, respectively. We believe that the amounts accrued are appropriate; however, our liabilities could be
significantly affected if future occurrences or loss developments differ from our assumptions. For example, a
5 percent increase or decrease in average claim costs would impact our self-insurance expense by $32 million in
2011. Historically, adjustments to our estimates have not been material. Refer to Item 7A for further disclosure of the
market risks associated with these exposures.
Income taxes We pay income taxes based on the tax statutes, regulations and case law of the various jurisdictions
in which we operate. Significant judgment is required in determining the timing and amounts of deductible and
taxable items and in evaluating the ultimate resolution of tax matters in dispute with tax authorities. The benefits of
uncertain tax positions are recorded in our financial statements only after determining whether it is likely the
uncertain tax positions would withstand challenge by taxing authorities. We periodically reassess these
probabilities, and record any changes in the financial statements as deemed appropriate. Liabilities for tax positions
considered uncertain, including interest and penalties, were $318 million and $397 million at January 28, 2012 and
January 29, 2011, respectively. We believe the resolution of these matters will not have a material adverse impact on
our consolidated financial statements. Income taxes are described further in Note 22 of the Notes to Consolidated
Financial Statements.
Pension and postretirement health care accounting We fund and maintain a qualified defined benefit pension
plan. We also maintain several smaller nonqualified plans and a postretirement health care plan for certain current
and retired team members. The costs for these plans are determined based on actuarial calculations using the
assumptions described in the following paragraphs. Eligibility for, and the level of, these benefits varies depending
on team members’ full-time or part-time status, date of hire and/or length of service.
Our expected long-term rate of return on plan assets of 8.0% is determined by the portfolio composition,
historical long-term investment performance and current market conditions. Our compound annual rate of return on
qualified plans’ assets was 5.1 percent, 7.8 percent and 8.3 percent for the 5-year, 10-year and 15-year periods,
respectively. Benefits expense recorded during the year is partially dependent upon the long-term rate of return
used. A one percentage point decrease in the expected long-term rate of return used to determine net pension and
postretirement health care benefits expense would increase annual expense by $26 million.
The discount rate used to determine benefit obligations is adjusted annually based on the interest rate for
long-term high-quality corporate bonds as of the measurement date, using yields for maturities that are in line with
the duration of our pension liabilities. Therefore, these liabilities fluctuate with changes in interest rates. Historically,
26