Target 2011 Annual Report Download - page 57
Download and view the complete annual report
Please find page 57 of the 2011 Target annual report below. You can navigate through the pages in the report by either clicking on the pages listed below, or by using the keyword search tool below to find specific information within the annual report.-
 1
1 -
2
-
3
-
4
-
5
-
6
-
7
-
8
-
9
-
10
-
11
-
12
-
13
-
14
-
15
-
16
-
17
-
18
-
19
-
20
-
21
-
22
-
23
-
24
-
25
-
26
-
27
-
28
-
29
-
30
-
31
-
32
-
33
-
34
-
35
-
36
-
37
-
38
-
39
-
40
-
41
-
42
-
43
-
44
-
45
-
46
-
 47
47 -
 48
48 -
 49
49 -
 50
50 -
 51
51 -
 52
52 -
 53
53 -
 54
54 -
 55
55 -
 56
56 -
 57
57 -
 58
58 -
 59
59 -
 60
60 -
 61
61 -
 62
62 -
 63
63 -
 64
64 -
 65
65 -
 66
66 -
 67
67 -
68
-
69
-
70
-
71
-
72
-
73
-
74
-
75
-
76
-
77
-
78
-
79
-
80
-
81
-
82
-
83
-
84
-
85
-
86
-
87
-
88
-
89
-
90
-
91
-
92
-
93
-
94
-
95
-
96
-
97
-
98
-
99
-
100
 |
 |

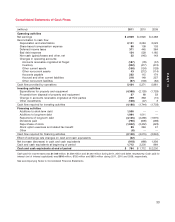
Consolidated Statements of Cash Flows
(millions) 2011 2010 2009
Operating activities
Net earnings $ 2,929 $ 2,920 $ 2,488
Reconciliation to cash flow
Depreciation and amortization 2,131 2,084 2,023
Share-based compensation expense 90 109 103
Deferred income taxes 371 445 364
Bad debt expense 154 528 1,185
Non-cash (gains)/losses and other, net 22 (145) 143
Changes in operating accounts:
Accounts receivable originated at Target (187) (78) (57)
Inventory (322) (417) (474)
Other current assets (150) (124) (129)
Other noncurrent assets 43 (212) (114)
Accounts payable 232 115 174
Accrued and other current liabilities 218 149 257
Other noncurrent liabilities (97) (103) (82)
Cash flow provided by operations 5,434 5,271 5,881
Investing activities
Expenditures for property and equipment (4,368) (2,129) (1,729)
Proceeds from disposal of property and equipment 37 69 33
Change in accounts receivable originated at third parties 259 363 (10)
Other investments (108) (47) 3
Cash flow required for investing activities (4,180) (1,744) (1,703)
Financing activities
Additions to short-term debt 1,500 ——
Additions to long-term debt 1,994 1,011 —
Reductions of long-term debt (3,125) (2,259) (1,970)
Dividends paid (750) (609) (496)
Repurchase of stock (1,842) (2,452) (423)
Stock option exercises and related tax benefit 89 294 47
Other (6) ——
Cash flow required for financing activities (2,140) (4,015) (2,842)
Effect of exchange rate changes on cash and cash equivalents (32) ——
Net increase (decrease) in cash and cash equivalents (918) (488) 1,336
Cash and cash equivalents at beginning of period 1,712 2,200 864
Cash and cash equivalents at end of period $ 794 $ 1,712 $ 2,200
Cash paid for income taxes was $1,109 million, $1,259 million and $1,040 million during 2011, 2010 and 2009, respectively. Cash paid for
interest (net of interest capitalized) was $816 million, $752 million and $805 million during 2011, 2010 and 2009, respectively.
See accompanying Notes to Consolidated Financial Statements.
33
PART II