Target 2011 Annual Report Download - page 37
Download and view the complete annual report
Please find page 37 of the 2011 Target annual report below. You can navigate through the pages in the report by either clicking on the pages listed below, or by using the keyword search tool below to find specific information within the annual report.-
 1
1 -
2
-
3
-
4
-
5
-
6
-
7
-
8
-
9
-
10
-
11
-
12
-
13
-
14
-
15
-
16
-
17
-
18
-
19
-
20
-
21
-
22
-
23
-
24
-
25
-
26
-
 27
27 -
 28
28 -
 29
29 -
 30
30 -
 31
31 -
 32
32 -
 33
33 -
 34
34 -
 35
35 -
 36
36 -
 37
37 -
 38
38 -
 39
39 -
 40
40 -
 41
41 -
 42
42 -
 43
43 -
 44
44 -
 45
45 -
 46
46 -
 47
47 -
48
-
49
-
50
-
51
-
52
-
53
-
54
-
55
-
56
-
57
-
58
-
59
-
60
-
61
-
62
-
63
-
64
-
65
-
66
-
67
-
68
-
69
-
70
-
71
-
72
-
73
-
74
-
75
-
76
-
77
-
78
-
79
-
80
-
81
-
82
-
83
-
84
-
85
-
86
-
87
-
88
-
89
-
90
-
91
-
92
-
93
-
94
-
95
-
96
-
97
-
98
-
99
-
100
 |
 |

14MAR201216093899
140
120
100
80
Dollars ($)
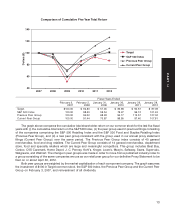
Comparison of Cumulative Five Year Total Return
60
40
2007 2008 2009 2010 2011 2012
Target
S&P 500 Index
Previous Peer Group
Current Peer Group
Fiscal Years Ended
February 3, February 2, January 31, January 30, January 29, January 28,
2007 2008 2009 2010 2011 2012
Target $100.00 $ 92.80 $ 51.45 $ 85.96 $ 92.57 $ 87.09
S&P 500 Index 100.00 98.20 59.54 79.27 96.12 101.24
Previous Peer Group 100.00 94.02 68.93 94.17 112.57 127.02
Current Peer Group 100.00 91.44 70.87 86.95 97.40 107.81
The graph above compares the cumulative total shareholder return on our common stock for the last five fiscal
years with (i) the cumulative total return on the S&P 500 Index, (ii) the peer group used in previous filings consisting
of the companies comprising the S&P 500 Retailing Index and the S&P 500 Food and Staples Retailing Index
(Previous Peer Group), and (iii) a new peer group consistent with the group used in our annual proxy statement
filings (Current Peer Group) over the same period. The Previous Peer Group index consists of 40 general
merchandise, food and drug retailers. The Current Peer Group consists of 14 general merchandise, department
store, food and specialty retailers which are large and meaningful competitors. This group includes Best Buy,
Costco, CVS Caremark, Home Depot, J. C. Penney, Kohl’s, Kroger, Lowe’s, Macy’s, Safeway, Sears, Supervalu,
Walgreens, and Walmart. The change in peer groups was made in order to move from a published industry index to
a group consisting of the same companies we use as our retail peer group for our definitive Proxy Statement to be
filed on or about April 30, 2012.
Both peer groups are weighted by the market capitalization of each component company. The graph assumes
the investment of $100 in Target common stock, the S&P 500 Index, the Previous Peer Group and the Current Peer
Group on February 3, 2007, and reinvestment of all dividends.
13
PART II