Target 2011 Annual Report Download - page 43
Download and view the complete annual report
Please find page 43 of the 2011 Target annual report below. You can navigate through the pages in the report by either clicking on the pages listed below, or by using the keyword search tool below to find specific information within the annual report.-
 1
1 -
2
-
3
-
4
-
5
-
6
-
7
-
8
-
9
-
10
-
11
-
12
-
13
-
14
-
15
-
16
-
17
-
18
-
19
-
20
-
21
-
22
-
23
-
24
-
25
-
26
-
27
-
28
-
29
-
30
-
31
-
32
-
 33
33 -
 34
34 -
 35
35 -
 36
36 -
 37
37 -
 38
38 -
 39
39 -
 40
40 -
 41
41 -
 42
42 -
 43
43 -
 44
44 -
 45
45 -
 46
46 -
 47
47 -
 48
48 -
 49
49 -
 50
50 -
 51
51 -
 52
52 -
 53
53 -
54
-
55
-
56
-
57
-
58
-
59
-
60
-
61
-
62
-
63
-
64
-
65
-
66
-
67
-
68
-
69
-
70
-
71
-
72
-
73
-
74
-
75
-
76
-
77
-
78
-
79
-
80
-
81
-
82
-
83
-
84
-
85
-
86
-
87
-
88
-
89
-
90
-
91
-
92
-
93
-
94
-
95
-
96
-
97
-
98
-
99
-
100
 |
 |

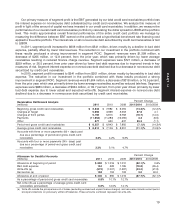
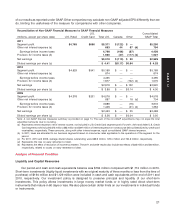
Our primary measure of segment profit is the EBIT generated by our total credit card receivables portfolio less
the interest expense on nonrecourse debt collateralized by credit card receivables. We analyze this measure of
profit in light of the amount of capital we have invested in our credit card receivables. In addition, we measure the
performance of our overall credit card receivables portfolio by calculating the dollar spread to LIBOR at the portfolio
level. This metric approximates overall financial performance of the entire credit card portfolio we manage by
measuring the difference between EBIT earned on the portfolio and a hypothetical benchmark rate financing cost
applied to the entire portfolio. The interest rate on all nonrecourse debt securitized by credit card receivables is tied
to LIBOR.
In 2011, segment profit increased to $606 million from $541 million, driven mostly by a decline in bad debt
expense, partially offset by lower total revenues. The reduction in our investment in the portfolio combined with
these results produced a strong improvement in segment ROIC. Segment revenues were $1,399 million, a
decrease of $205 million, or 12.8 percent, from the prior year, which was primarily driven by lower average
receivables resulting in reduced finance charge revenue. Segment expenses were $721 million, a decrease of
$259 million, or 26.5 percent, from prior year driven by lower bad debt expense due to improved trends in key
measures of risk. Segment interest expense on nonrecourse debt declined due to a decrease in nonrecourse debt
securitized by credit card receivables.
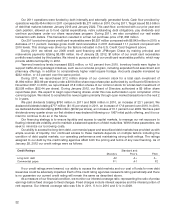
In 2010, segment profit increased to $541 million from $201 million, driven mostly by favorability in bad debt
expense. The reduction in our investment in the portfolio combined with these results produced a strong
improvement in segment ROIC. Segment revenues were $1,604 million, a decrease of $318 million, or 16.5 percent,
from the prior year, which was primarily driven by lower average receivables as well as reduced late fees. Segment
expenses were $980 million, a decrease of $644 million, or 39.7 percent, from prior year driven primarily by lower
bad debt expense due to lower actual and expected write-offs. Segment interest expense on nonrecourse debt
declined due to a decrease in nonrecourse debt securitized by credit card receivables.
Percent Change
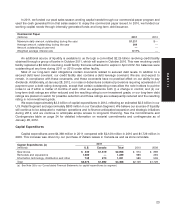
Receivables Rollforward Analysis
(millions) 2011 2010 2009 2011/2010 2010/2009
Beginning gross credit card receivables $ 6,843 $ 7,982 $ 9,094 (14.3)% (12.2)%
Charges at Target 5,098 3,699 3,553 37.8 4.1
Charges at third parties 5,192 5,815 6,763 (10.7) (14.0)
Payments (11,653) (11,283) (12,065) 3.3 (6.5)
Other 877 630 637 39.3 (1.1)
Period-end gross credit card receivables $ 6,357 $ 6,843 $ 7,982 (7.1)% (14.3)%
Average gross credit card receivables $ 6,314 $ 7,106 $ 8,351 (11.1)% (14.9)%
Accounts with three or more payments (60+ days) past
due as a percentage of period-end gross credit card
receivables 3.3% 4.2% 6.3%
Accounts with four or more payments (90+ days) past
due as a percentage of period-end gross credit card
receivables 2.3% 3.1% 4.7%
Percent Change
Allowance for Doubtful Accounts
(millions) 2011 2010 2009 2011/2010 2010/2009
Allowance at beginning of period $ 690 $ 1,016 $ 1,010 (32.1)% 0.6%
Bad debt expense 154 528 1,185 (70.8) (55.4)
Write-offs (a) (572) (1,007) (1,287) (43.2) (21.8)
Recoveries (a) 158 153 108 3.0 40.2
Allowance at end of period $ 430 $ 690 $ 1,016 (37.7)% (32.1)%
As a percentage of period-end gross credit card receivables 6.8% 10.1% 12.7%
Net write-offs as a percentage of average gross credit card
receivables (annualized) 6.6% 12.0% 14.1%
(a) Write-offs include the principal amount of losses (excluding accrued and unpaid finance charges), and recoveries include current period
principal collections on previously written-off balances. These amounts combined represent net write-offs.
19
PART II