Target 2011 Annual Report Download - page 47
Download and view the complete annual report
Please find page 47 of the 2011 Target annual report below. You can navigate through the pages in the report by either clicking on the pages listed below, or by using the keyword search tool below to find specific information within the annual report.-
 1
1 -
2
-
3
-
4
-
5
-
6
-
7
-
8
-
9
-
10
-
11
-
12
-
13
-
14
-
15
-
16
-
17
-
18
-
19
-
20
-
21
-
22
-
23
-
24
-
25
-
26
-
27
-
28
-
29
-
30
-
31
-
32
-
33
-
34
-
35
-
36
-
 37
37 -
 38
38 -
 39
39 -
 40
40 -
 41
41 -
 42
42 -
 43
43 -
 44
44 -
 45
45 -
 46
46 -
 47
47 -
 48
48 -
 49
49 -
 50
50 -
 51
51 -
 52
52 -
 53
53 -
 54
54 -
 55
55 -
 56
56 -
 57
57 -
58
-
59
-
60
-
61
-
62
-
63
-
64
-
65
-
66
-
67
-
68
-
69
-
70
-
71
-
72
-
73
-
74
-
75
-
76
-
77
-
78
-
79
-
80
-
81
-
82
-
83
-
84
-
85
-
86
-
87
-
88
-
89
-
90
-
91
-
92
-
93
-
94
-
95
-
96
-
97
-
98
-
99
-
100
 |
 |
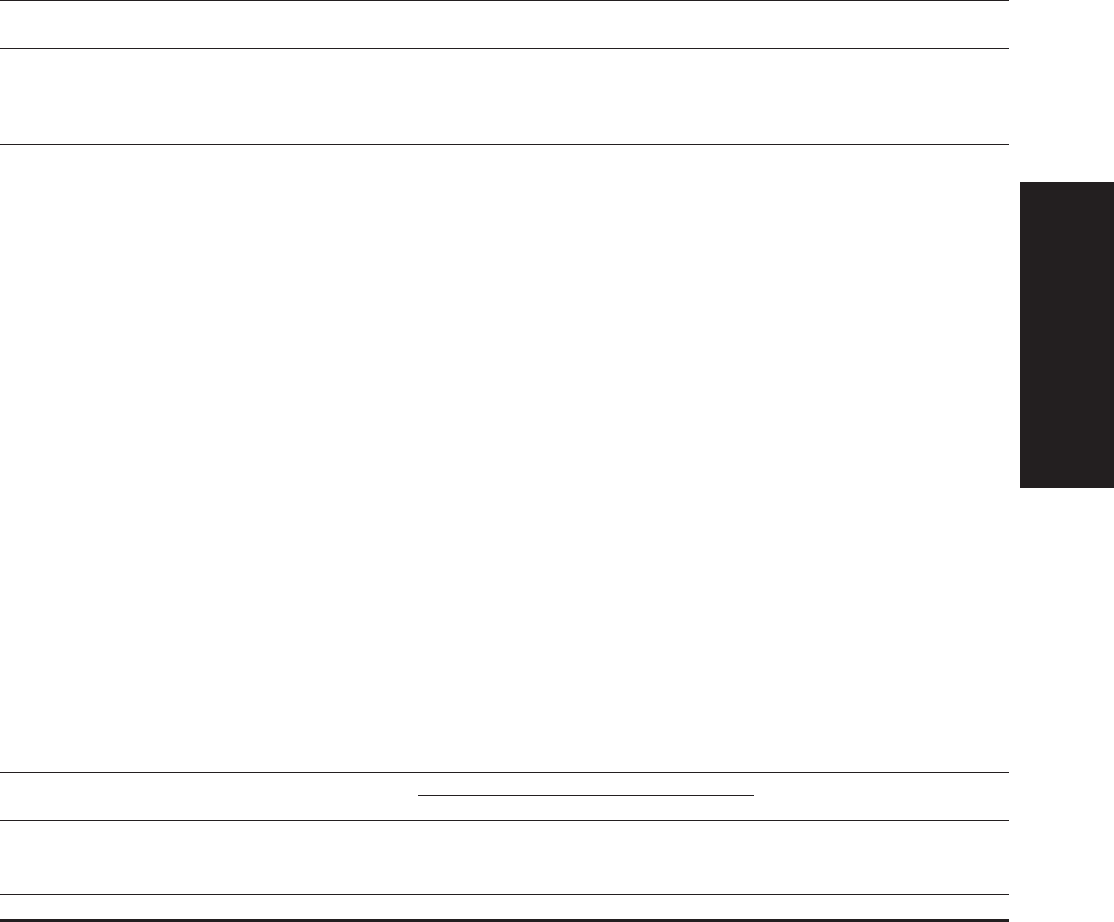
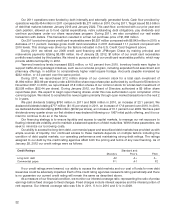
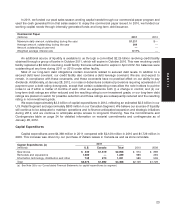
In 2011, we funded our peak sales season working capital needs through our commercial paper program and
used the cash generated from that sales season to repay the commercial paper issued. In 2010, we funded our
working capital needs through internally generated funds and long-term debt issuance.
Commercial Paper
(millions) 2011 2010
Maximum daily amount outstanding during the year $1,211 $—
Average amount outstanding during the year 244 —
Amount outstanding at year-end ——
Weighted average interest rate 0.11% —
An additional source of liquidity is available to us through a committed $2.25 billion revolving credit facility
obtained through a group of banks in October 2011, which will expire in October 2016. This new revolving credit
facility replaced a $2 billion revolving credit facility that was scheduled to expire in April 2012. No balances were
outstanding at any time during 2011 or 2010 under either facility.
Most of our long-term debt obligations contain covenants related to secured debt levels. In addition to a
secured debt level covenant, our credit facility also contains a debt leverage covenant. We are, and expect to
remain, in compliance with these covenants, and these covenants have no practical effect on our ability to pay
dividends. Additionally, at January 28, 2012, no notes or debentures contained provisions requiring acceleration of
payment upon a debt rating downgrade, except that certain outstanding notes allow the note holders to put the
notes to us if within a matter of months of each other we experience both (i) a change in control; and (ii) our
long-term debt ratings are either reduced and the resulting rating is non-investment grade, or our long-term debt
ratings are placed on watch for possible reduction and those ratings are subsequently reduced and the resulting
rating is non-investment grade.
We expect approximately $3.3 billion of capital expenditures in 2012, reflecting an estimated $2.5 billion in our
U.S. Retail Segment and approximately $800 million in our Canadian Segment. We believe our sources of liquidity
will continue to be adequate to maintain operations and to finance anticipated expansion and strategic initiatives
during 2012, and we continue to anticipate ample access to long-term financing. See the Commitments and
Contingencies table on page 24 for detailed information on material commitments and contingencies as of
January 28, 2012.
Capital Expenditures
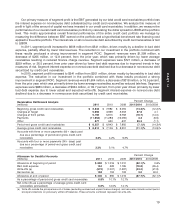
Capital expenditures were $4,368 million in 2011 compared with $2,129 million in 2010 and $1,729 million in
2009. This increase was driven by our purchase of Zellers leases in Canada as well as store remodels.
2011
Capital Expenditures (a)
(millions) U.S. Canada Total 2010 2009
New stores $ 439 $1,619 $2,058 $ 574 $ 899
Remodels and expansions 1,289 — 1,289 966 294
Information technology, distribution and other 748 273 1,021 589 536
Total $2,476 $1,892 $4,368 $2,129 $1,729
(a) See Note 28 to our Consolidated Financial Statements for capital expenditures by segment.
23
PART II