Target 2011 Annual Report Download - page 61
Download and view the complete annual report
Please find page 61 of the 2011 Target annual report below. You can navigate through the pages in the report by either clicking on the pages listed below, or by using the keyword search tool below to find specific information within the annual report.-
 1
1 -
2
-
3
-
4
-
5
-
6
-
7
-
8
-
9
-
10
-
11
-
12
-
13
-
14
-
15
-
16
-
17
-
18
-
19
-
20
-
21
-
22
-
23
-
24
-
25
-
26
-
27
-
28
-
29
-
30
-
31
-
32
-
33
-
34
-
35
-
36
-
37
-
38
-
39
-
40
-
41
-
42
-
43
-
44
-
45
-
46
-
47
-
48
-
49
-
50
-
 51
51 -
 52
52 -
 53
53 -
 54
54 -
 55
55 -
 56
56 -
 57
57 -
 58
58 -
 59
59 -
 60
60 -
 61
61 -
 62
62 -
 63
63 -
 64
64 -
 65
65 -
 66
66 -
 67
67 -
 68
68 -
 69
69 -
 70
70 -
 71
71 -
72
-
73
-
74
-
75
-
76
-
77
-
78
-
79
-
80
-
81
-
82
-
83
-
84
-
85
-
86
-
87
-
88
-
89
-
90
-
91
-
92
-
93
-
94
-
95
-
96
-
97
-
98
-
99
-
100
 |
 |

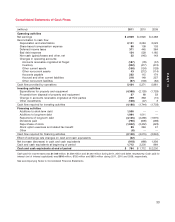
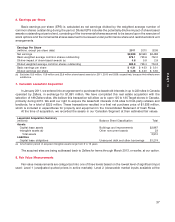
6. Earnings per Share
Basic earnings per share (EPS) is calculated as net earnings divided by the weighted average number of
common shares outstanding during the period. Diluted EPS includes the potentially dilutive impact of share-based
awards outstanding at period end, consisting of the incremental shares assumed to be issued upon the exercise of
stock options and the incremental shares assumed to be issued under performance share and restricted stock unit
arrangements.
Earnings Per Share
(millions, except per share data) 2011 2010 2009
Net earnings $2,929 $2,920 $2,488
Basic weighted average common shares outstanding 679.1 723.6 752.0
Dilutive impact of share-based awards (a) 4.8 5.8 2.8
Diluted weighted average common shares outstanding 683.9 729.4 754.8
Basic earnings per share $ 4.31 $ 4.03 $ 3.31
Diluted earnings per share $ 4.28 $ 4.00 $ 3.30
(a) Excludes 15.5 million, 10.9 million and 22.9 million share-based awards for 2011, 2010 and 2009, respectively, because their effects were
antidilutive.
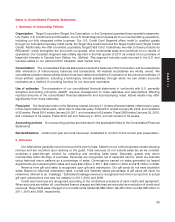
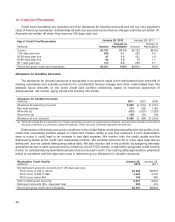
7. Canadian Leasehold Acquisition
In January 2011, we entered into an agreement to purchase the leasehold interests in up to 220 sites in Canada
operated by Zellers, in exchange for $1,861 million. We have completed this real estate acquisition with the
selection of 189 Zellers sites. We believe this transaction will allow us to open 125 to 135 Target stores in Canada,
primarily during 2013. We sold our right to acquire the leasehold interests in 54 sites to third-party retailers and
landlords, for a total of $225 million. These transactions resulted in a final net purchase price of $1,636 million,
which is included in expenditures for property and equipment in the Consolidated Statement of Cash Flows.
At the time of acquisition, we recorded the assets in our Canadian Segment at their estimated fair values.
Leasehold Acquisition Summary
(millions) Balance Sheet Classification Total
Assets
Capital lease assets Buildings and improvements $2,887
Intangible assets (a) Other noncurrent assets 23
Total assets 2,910
Liabilities
Capital lease obligations Unsecured debt and other borrowings $1,274
(a) Amortization period of acquired intangible assets range from 3 to 13 years.
The acquired sites are being subleased back to Zellers for terms through March 2013, or earlier, at our option.
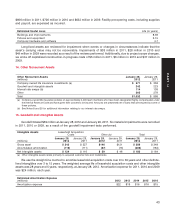
8. Fair Value Measurements
Fair value measurements are categorized into one of three levels based on the lowest level of significant input
used: Level 1 (unadjusted quoted prices in active markets); Level 2 (observable market inputs available at the
37
PART II