Target 2011 Annual Report Download - page 81
Download and view the complete annual report
Please find page 81 of the 2011 Target annual report below. You can navigate through the pages in the report by either clicking on the pages listed below, or by using the keyword search tool below to find specific information within the annual report.-
 1
1 -
2
-
3
-
4
-
5
-
6
-
7
-
8
-
9
-
10
-
11
-
12
-
13
-
14
-
15
-
16
-
17
-
18
-
19
-
20
-
21
-
22
-
23
-
24
-
25
-
26
-
27
-
28
-
29
-
30
-
31
-
32
-
33
-
34
-
35
-
36
-
37
-
38
-
39
-
40
-
41
-
42
-
43
-
44
-
45
-
46
-
47
-
48
-
49
-
50
-
51
-
52
-
53
-
54
-
55
-
56
-
57
-
58
-
59
-
60
-
61
-
62
-
63
-
64
-
65
-
66
-
67
-
68
-
69
-
70
-
 71
71 -
 72
72 -
 73
73 -
 74
74 -
 75
75 -
 76
76 -
 77
77 -
 78
78 -
 79
79 -
 80
80 -
 81
81 -
 82
82 -
 83
83 -
 84
84 -
 85
85 -
 86
86 -
 87
87 -
 88
88 -
 89
89 -
 90
90 -
 91
91 -
92
-
93
-
94
-
95
-
96
-
97
-
98
-
99
-
100
 |
 |

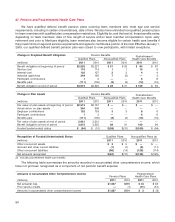
Plan Assets
Our asset allocation policy is designed to reduce the long-term cost of funding our pension obligations. The
plan invests with both passive and active investment managers depending on the investment’s asset class. The
plan also seeks to reduce the risk associated with adverse movements in interest rates by employing an interest
rate hedging program, which may include the use of interest rate swaps, total return swaps and other instruments.
Actual AllocationAsset Category Current targeted
allocation 2011 2010
Domestic equity securities (a) 19% 19% 18%
International equity securities 12 11 10
Debt securities 25 29 25
Balanced funds 30 25 26
Other (b) 14 16 21
Total 100% 100% 100%
(a) Equity securities include our common stock in amounts substantially less than 1 percent of total plan assets as of January 28, 2012 and
January 29, 2011.
(b) Other assets include private equity, mezzanine and high-yield debt, natural resources and timberland funds, multi-strategy hedge funds,
derivative instruments and a 4 percent allocation to real estate.
Fair Value at January 28, 2012 Fair Value at January 29, 2011Fair Value Measurements
(millions) Total Level 1 Level 2 Level 3 Total Level 1 Level 2 Level 3
Cash and cash equivalents $ 263 $11 $ 252 $ — $ 195 $— $ 195 $ —
Common collective trusts (a) 653 — 653 — 490 — 490 —
Equity securities (b) ————36 36 — —
Government securities (c) 356 — 356 — 259 — 259 —
Fixed income (d) 466 — 466 — 397 — 397 —
Balanced funds (e) 744 — 744 — 596 — 596 —
Private equity funds (f) 283 — — 283 327 — — 327
Other (g) 156 — 41 115 130 — 3 127
Total $2,921 $11 $2,512 $398 $2,430 $36 $1,940 $454
Contributions in transit (h) —85
Total plan assets $2,921 $2,515
(a) Passively managed index funds with holdings in domestic and international equities.
(b) Investments in U.S. small-, mid- and large-cap companies.
(c) Investments in government securities and passively managed index funds with holdings in long-term government bonds.
(d) Investments in corporate bonds, mortgage-backed securities and passively managed index funds with holdings in long-term corporate
bonds.
(e) Investments in equities, nominal and inflation-linked fixed income securities, commodities and public real estate.
(f) Includes investments in venture capital, mezzanine and high-yield debt, natural resources and timberland funds.
(g) Investments in multi-strategy hedge funds (including domestic and international equity securities, convertible bonds and other alternative
investments), real estate and derivative investments.
(h) Represents $20 million in contributions to equity securities and $65 million in contributions to balanced funds held by investment
managers, but not yet invested in the respective funds as of January 29, 2011.
Actual return on plan assets (a)Level 3 Reconciliation
Relating to Relating to
Balance at assets still held assets sold Purchases, Transfer in
beginning of at the reporting during the sales and and/or out of Balance at
(millions) period date period settlements Level 3 end of period
2010
Private equity funds $336 $28 $12 $(49) $— $327
Other 119 7 2 (1) — 127
2011
Private equity funds $327 $ (6) $26 $(64) $— $283
Other 127 9 — (21) — 115
(a) Represents realized and unrealized gains (losses) from changes in values of those financial instruments only for the period in which the
instruments were classified as Level 3.
57
PART II