Target 2011 Annual Report Download - page 20
Download and view the complete annual report
Please find page 20 of the 2011 Target annual report below. You can navigate through the pages in the report by either clicking on the pages listed below, or by using the keyword search tool below to find specific information within the annual report.-
 1
1 -
2
-
3
-
4
-
5
-
6
-
7
-
8
-
9
-
 10
10 -
 11
11 -
 12
12 -
 13
13 -
 14
14 -
 15
15 -
 16
16 -
 17
17 -
 18
18 -
 19
19 -
 20
20 -
 21
21 -
 22
22 -
 23
23 -
 24
24 -
 25
25 -
 26
26 -
 27
27 -
 28
28 -
 29
29 -
 30
30 -
31
-
32
-
33
-
34
-
35
-
36
-
37
-
38
-
39
-
40
-
41
-
42
-
43
-
44
-
45
-
46
-
47
-
48
-
49
-
50
-
51
-
52
-
53
-
54
-
55
-
56
-
57
-
58
-
59
-
60
-
61
-
62
-
63
-
64
-
65
-
66
-
67
-
68
-
69
-
70
-
71
-
72
-
73
-
74
-
75
-
76
-
77
-
78
-
79
-
80
-
81
-
82
-
83
-
84
-
85
-
86
-
87
-
88
-
89
-
90
-
91
-
92
-
93
-
94
-
95
-
96
-
97
-
98
-
99
-
100
 |
 |
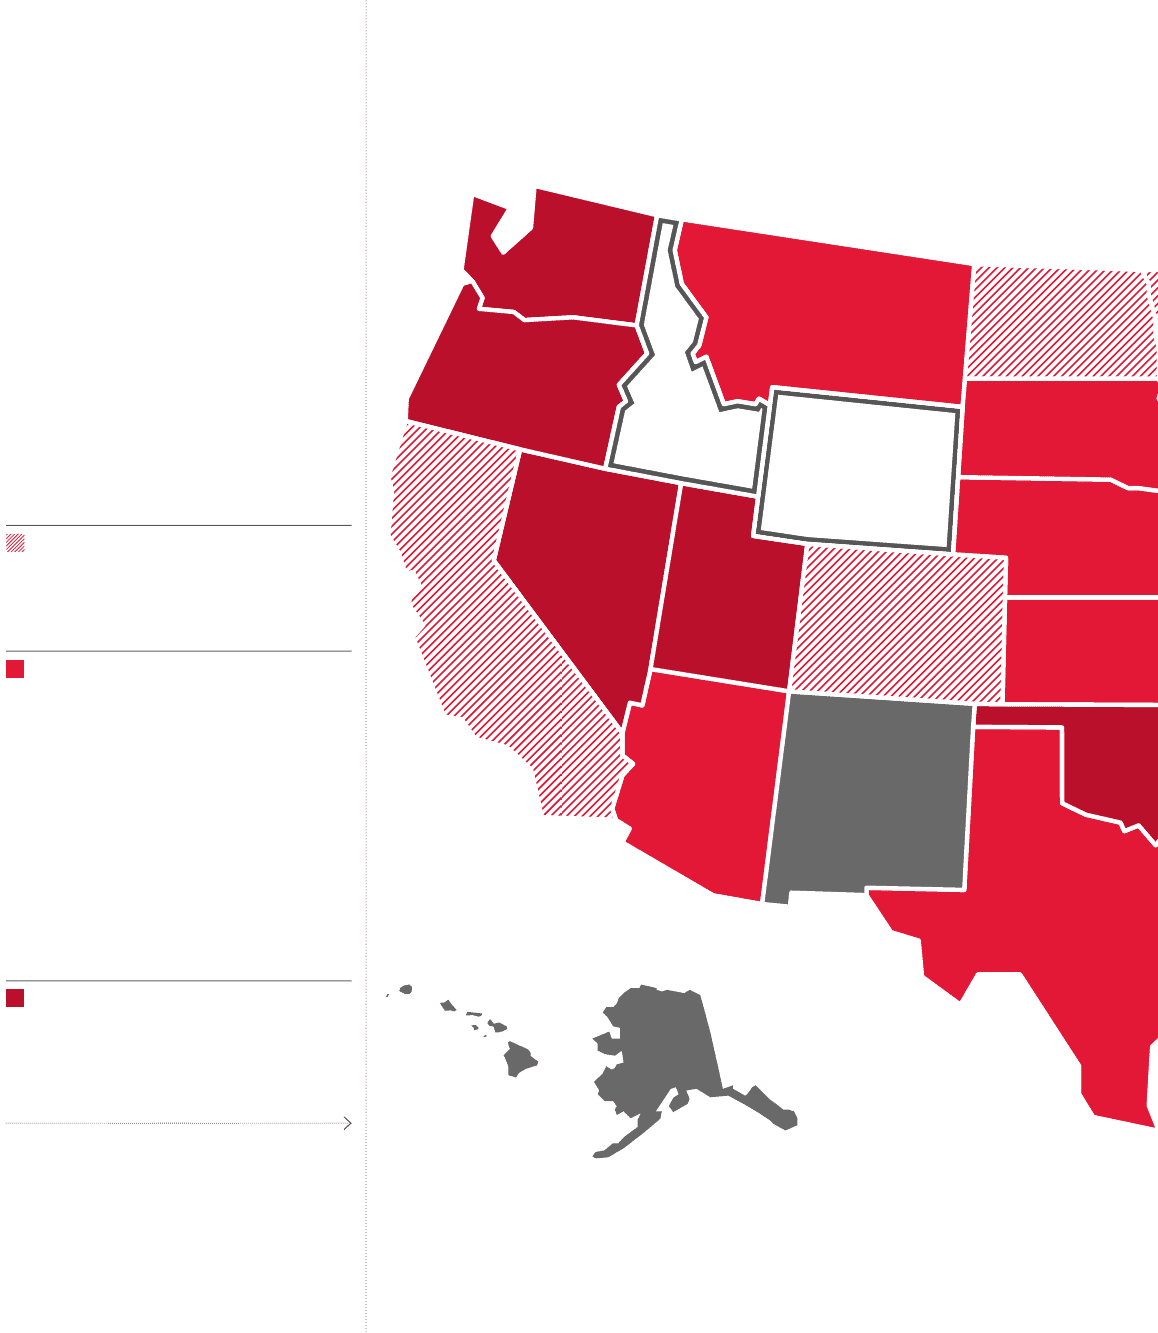
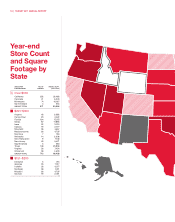
Year-end
Store Count
and Square
Footage by
State
SALES PER NO. OF RETAIL SQ. FT.
CAPITA GROUP STORES (THOUSANDS)
Over $300
California 252 33,483
Colorado 41 6,200
Minnesota 74 10,627
North Dakota 4 554
GROUP TOTAL 371 50,864
$201–$300
Arizona 48 6,382
Connecticut 20 2,672
Florida 124 17,375
Illinois 87 11,895
Iowa 22 3,015
Kansas 19 2,577
Maryland 36 4,667
Massachusetts 36 4,735
Montana 7 780
Nebraska 14 2,006
New Hampshire 9 1,148
New Jersey 43 5,671
South Dakota 5 580
Texas 148 20,838
Virginia 56 7,454
Wisconsin 38 4,633
GROUP TOTAL 712 96,428
$151–$200
Delaware 3 413
Georgia 55 7,517
Indiana 33 4,377
Michigan 59 7,031
Missouri 36 4,735
Nevada 19 2,461
18 | TARGET 2011 ANNUAL REPORT