Target 2011 Annual Report Download - page 76
Download and view the complete annual report
Please find page 76 of the 2011 Target annual report below. You can navigate through the pages in the report by either clicking on the pages listed below, or by using the keyword search tool below to find specific information within the annual report.-
 1
1 -
2
-
3
-
4
-
5
-
6
-
7
-
8
-
9
-
10
-
11
-
12
-
13
-
14
-
15
-
16
-
17
-
18
-
19
-
20
-
21
-
22
-
23
-
24
-
25
-
26
-
27
-
28
-
29
-
30
-
31
-
32
-
33
-
34
-
35
-
36
-
37
-
38
-
39
-
40
-
41
-
42
-
43
-
44
-
45
-
46
-
47
-
48
-
49
-
50
-
51
-
52
-
53
-
54
-
55
-
56
-
57
-
58
-
59
-
60
-
61
-
62
-
63
-
64
-
65
-
 66
66 -
 67
67 -
 68
68 -
 69
69 -
 70
70 -
 71
71 -
 72
72 -
 73
73 -
 74
74 -
 75
75 -
 76
76 -
 77
77 -
 78
78 -
 79
79 -
 80
80 -
 81
81 -
 82
82 -
 83
83 -
 84
84 -
 85
85 -
 86
86 -
87
-
88
-
89
-
90
-
91
-
92
-
93
-
94
-
95
-
96
-
97
-
98
-
99
-
100
 |
 |

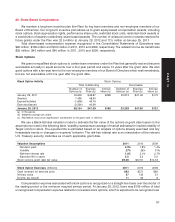
a weighted average period of 1.4 years. The weighted average remaining life of currently exercisable options is
5.0 years, and the weighted average remaining life of all outstanding options is 6.6 years. The total fair value of
options vested was $75 million, $87 million and $85 million in 2011, 2010 and 2009, respectively.
Performance Share Units
We have issued performance share units to certain team members annually since January 2003. These units
represent shares potentially issuable in the future. Issuance is based upon our performance relative to a retail peer
group over a three-year performance period on two measures: domestic market share change and EPS growth.
The fair value of performance share units is calculated based on the stock price on the date of grant. The weighted
average grant date fair value for performance share units was $48.63 in 2011, $52.62 in 2010 and $27.18 in 2009.
Performance Share Unit Activity Total Nonvested Units
Performance Grant Date
Share Units (a) Price (b)
January 29, 2011 1,984 $42.10
Granted 476 48.63
Forfeited (908) 49.09
Vested ——
January 28, 2012 1,552 $39.93
(a) Assumes attainment of maximum payout rates as set forth in the performance criteria based in thousands of share units. Applying actual
or expected payout rates, the number of outstanding units at January 28, 2012 was 1,128 thousand.
(b) Weighted average per unit.
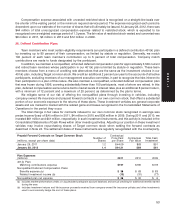
Compensation expense associated with unvested performance share units is recognized on a straight-line
basis over the shorter of the vesting period or the minimum required service period. The expense recognized each
period is dependent upon our estimate of the number of shares that will ultimately be issued. Future compensation
expense for currently unvested awards could reach a maximum of $19 million assuming payout of all unvested
awards. The unrecognized expense is expected to be recognized over a weighted average period of 0.8 years. The
fair value of performance share units vested and converted was not significant in 2011, 2010 and 2009.
Restricted Stock
We issue restricted stock units and restricted stock awards (collectively restricted stock) to certain team
members with three-year cliff vesting from the date of grant. We also regularly issue restricted stock units to our
Board of Directors, which vest quarterly over a one-year period and are settled in shares of Target common stock
upon departure from the Board. Restricted stock units represent shares potentially issuable in the future whereas
restricted stock awards represent shares issued upon grant that are restricted. The fair value for restricted stock
units and restricted stock awards is calculated based on the stock price on the date of grant. The weighted average
grant date fair value for restricted stock was $49.42 in 2011, $55.17 in 2010 and $49.41 in 2009.
Restricted Stock Activity Total Nonvested Units
Restricted Grant Date
Stock (a) Price (b)
January 29, 2011 1,138 $48.29
Granted 816 49.42
Forfeited (99) 46.03
Vested (245) 34.25
January 28, 2012 1,610 $50.76
(a) Represents the number of restricted stock units and restricted stock awards, in thousands.
(b) Weighted average per unit.
52