Target 2011 Annual Report Download - page 67
Download and view the complete annual report
Please find page 67 of the 2011 Target annual report below. You can navigate through the pages in the report by either clicking on the pages listed below, or by using the keyword search tool below to find specific information within the annual report.-
 1
1 -
2
-
3
-
4
-
5
-
6
-
7
-
8
-
9
-
10
-
11
-
12
-
13
-
14
-
15
-
16
-
17
-
18
-
19
-
20
-
21
-
22
-
23
-
24
-
25
-
26
-
27
-
28
-
29
-
30
-
31
-
32
-
33
-
34
-
35
-
36
-
37
-
38
-
39
-
40
-
41
-
42
-
43
-
44
-
45
-
46
-
47
-
48
-
49
-
50
-
51
-
52
-
53
-
54
-
55
-
56
-
 57
57 -
 58
58 -
 59
59 -
 60
60 -
 61
61 -
 62
62 -
 63
63 -
 64
64 -
 65
65 -
 66
66 -
 67
67 -
 68
68 -
 69
69 -
 70
70 -
 71
71 -
 72
72 -
 73
73 -
 74
74 -
 75
75 -
 76
76 -
 77
77 -
78
-
79
-
80
-
81
-
82
-
83
-
84
-
85
-
86
-
87
-
88
-
89
-
90
-
91
-
92
-
93
-
94
-
95
-
96
-
97
-
98
-
99
-
100
 |
 |

$666 million in 2011, $726 million in 2010 and $632 million in 2009. Facility pre-opening costs, including supplies
and payroll, are expensed as incurred.
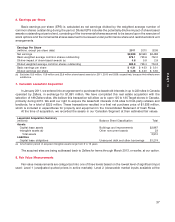
Estimated Useful Lives Life (in years)
Buildings and improvements 8-39
Fixtures and equipment 3-15
Computer hardware and software 4-7
Long-lived assets are reviewed for impairment when events or changes in circumstances indicate that the
asset’s carrying value may not be recoverable. Impairments of $38 million in 2011, $28 million in 2010 and
$49 million in 2009 were recorded as a result of the reviews performed. Additionally, due to project scope changes,
we wrote off capitalized construction-in-progress costs of $5 million in 2011, $6 million in 2010 and $37 million in
2009.
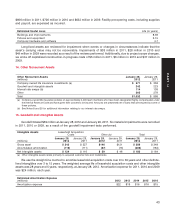
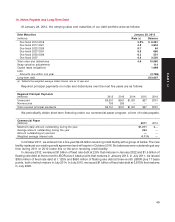
14. Other Noncurrent Assets
Other Noncurrent Assets January 28, January 29,
(millions) 2012 2011
Company-owned life insurance investments (a) $ 371 $ 358
Goodwill and intangible assets 242 223
Interest rate swaps (b) 114 139
Other 305 279
Total $1,032 $ 999
(a) Company-owned life insurance policies on approximately 4,000 team members who have been designated highly compensated under
the Internal Revenue Code and have given their consent to be insured. Amounts are presented net of loans that are secured by some of
these policies.
(b) See Notes 8 and 20 for additional information relating to our interest rate swaps.
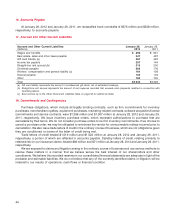
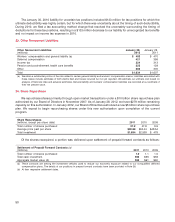
15. Goodwill and Intangible Assets
Goodwill totaled $59 million at January 28, 2012 and January 29, 2011. No material impairments were recorded
in 2011, 2010 or 2009, as a result of the goodwill impairment tests performed.
Intangible Assets Leasehold Acquisition
Costs Other (a) Total
January 28, January 29, January 28, January 29, January 28, January 29,
(millions) 2012 2011 2012 2011 2012 2011
Gross asset $ 243 $ 227 $146 $121 $ 389 $ 348
Accumulated amortization (119) (111) (87) (73) (206) (184)
Net intangible assets $ 124 $ 116 $59 $48 $ 183 $ 164
(a) Other intangible assets relate primarily to acquired customer lists and trademarks.
We use the straight-line method to amortize leasehold acquisition costs over 9 to 39 years and other definite-
lived intangibles over 3 to 15 years. The weighted average life of leasehold acquisition costs and other intangible
assets was 28 years and 5 years, respectively, at January 28, 2012. Amortization expense for 2011, 2010 and 2009
was $24 million, each year.
Estimated Amortization Expense
(millions) 2012 2013 2014 2015 2016
Amortization expense $22 $19 $16 $16 $15
43
PART II