Target 2011 Annual Report Download - page 82
Download and view the complete annual report
Please find page 82 of the 2011 Target annual report below. You can navigate through the pages in the report by either clicking on the pages listed below, or by using the keyword search tool below to find specific information within the annual report.-
 1
1 -
2
-
3
-
4
-
5
-
6
-
7
-
8
-
9
-
10
-
11
-
12
-
13
-
14
-
15
-
16
-
17
-
18
-
19
-
20
-
21
-
22
-
23
-
24
-
25
-
26
-
27
-
28
-
29
-
30
-
31
-
32
-
33
-
34
-
35
-
36
-
37
-
38
-
39
-
40
-
41
-
42
-
43
-
44
-
45
-
46
-
47
-
48
-
49
-
50
-
51
-
52
-
53
-
54
-
55
-
56
-
57
-
58
-
59
-
60
-
61
-
62
-
63
-
64
-
65
-
66
-
67
-
68
-
69
-
70
-
71
-
 72
72 -
 73
73 -
 74
74 -
 75
75 -
 76
76 -
 77
77 -
 78
78 -
 79
79 -
 80
80 -
 81
81 -
 82
82 -
 83
83 -
 84
84 -
 85
85 -
 86
86 -
 87
87 -
 88
88 -
 89
89 -
 90
90 -
 91
91 -
 92
92 -
93
-
94
-
95
-
96
-
97
-
98
-
99
-
100
 |
 |

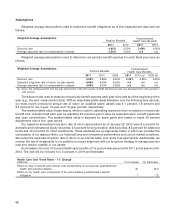
Position Valuation Technique
Cash and cash equivalents These investments are cash holdings and investment vehicles valued using the Net
Asset Value (NAV) provided by the administrator of the fund. The NAV for the
investment vehicles is based on the value of the underlying assets owned by the fund
minus applicable costs and liabilities, and then divided by the number of shares
outstanding.
Equity securities Valued at the closing price reported on the major market on which the individual
securities are traded.
Common collective trusts/ Valued using the NAV provided by the administrator of the fund. The NAV is a quoted
balanced funds/certain multi- transactional price for participants in the fund, which do not represent an active market.
strategy hedge funds
Fixed income and Valued using matrix pricing models and quoted prices of securities with similar
government securities characteristics.
Private equity/real estate/ Valued by deriving Target’s proportionate share of equity investment from audited
certain multi-strategy hedge financial statements. Private equity and real estate investments require significant
funds/other judgment on the part of the fund manager due to the absence of quoted market prices,
inherent lack of liquidity, and the long-term nature of such investments. Certain multi-
strategy hedge funds represent funds of funds that include liquidity restrictions and for
which timely valuation information is not available.
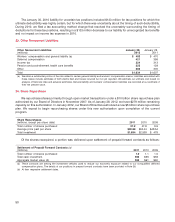
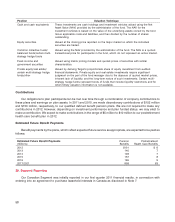
Contributions
Our obligations to plan participants can be met over time through a combination of company contributions to
these plans and earnings on plan assets. In 2011 and 2010, we made discretionary contributions of $152 million
and $153 million, respectively, to our qualified defined benefit pension plans. We are not required to make any
contributions in 2012. However, depending on investment performance and plan funded status, we may elect to
make a contribution. We expect to make contributions in the range of $5 million to $10 million to our postretirement
health care benefit plan in 2012.
Estimated Future Benefit Payments
Benefit payments by the plans, which reflect expected future service as appropriate, are expected to be paid as
follows:
Estimated Future Benefit Payments Pension Postretirement
(millions) Benefits Health Care Benefits
2012 $131 $ 6
2013 140 7
2014 149 7
2015 157 8
2016 165 9
2017-2021 958 63
28. Segment Reporting
Our Canadian Segment was initially reported in our first quarter 2011 financial results, in connection with
entering into an agreement to purchase leasehold interests in Canada as disclosed in Note 7.
58